


Trading Indices versus Individual Shares
What are Indices
In general terms an index is a measure or sign of something derived from a mathematical calculation. When it comes to the financial markets, indices are a statistical measure and benchmark of change. Equities indices are a selection of equities, compiled as a representation of a particular market or industry sector. Indices are also used in financial markets for nonequity financial instrument markets such as commodities, currencies and bonds.
The first ever index was The Dow Jones Industrial Average, created by Charles Dow in 1896.
There is no single, universally accepted and used methodology of how an index is calculated with different indices employing varying methodologies on weightings, though numerical change is almost always more important than actual numerical value. Different index providers use different methodologies and sometimes the same providers employ more than one methodology for different indices. While the most common methodology for financial markets indices is a capitisation weighting, some indices also take other factors, such as revenue or net income, into account. They must of course provide a logical explanation of why a particular methodology has been chosen as the best way of representing the market or industry that is the subject of the index.
Index providers occasionally change an index due keep it relevant as the market or sector it represents changes over time. For example, the FTSE 100 is the index representing the 100 largest companies by market capitisation listed on the London Stock Exchange. As the market capitilisation of those 100 companies changes, so do their weightings within the index. Every 3 months the constituents of the index are also updated as some companies drop out of the top 100 to be replaced by others that have overtaken them.
Some of the most well-known and followed equities indices around the world are:
- FTSE 100
- Dow Jones Industrial Average
- S&P 500
- NASDAQ Composite Index
- Nikkei 225
- Hang Seng
Why Trade Indices
Financial markets traders and investors look to profit by correctly forecasting the direction that financial instruments, such as individual companies’ share prices, indices, commodities prices, currencies and bonds, will take. They place bets that on whether a financial instrument’s price will move up or down, profiting or taking a loss on the difference between its starting and closing position when they open and close a trade.
There are several good reasons why investors trade indices:
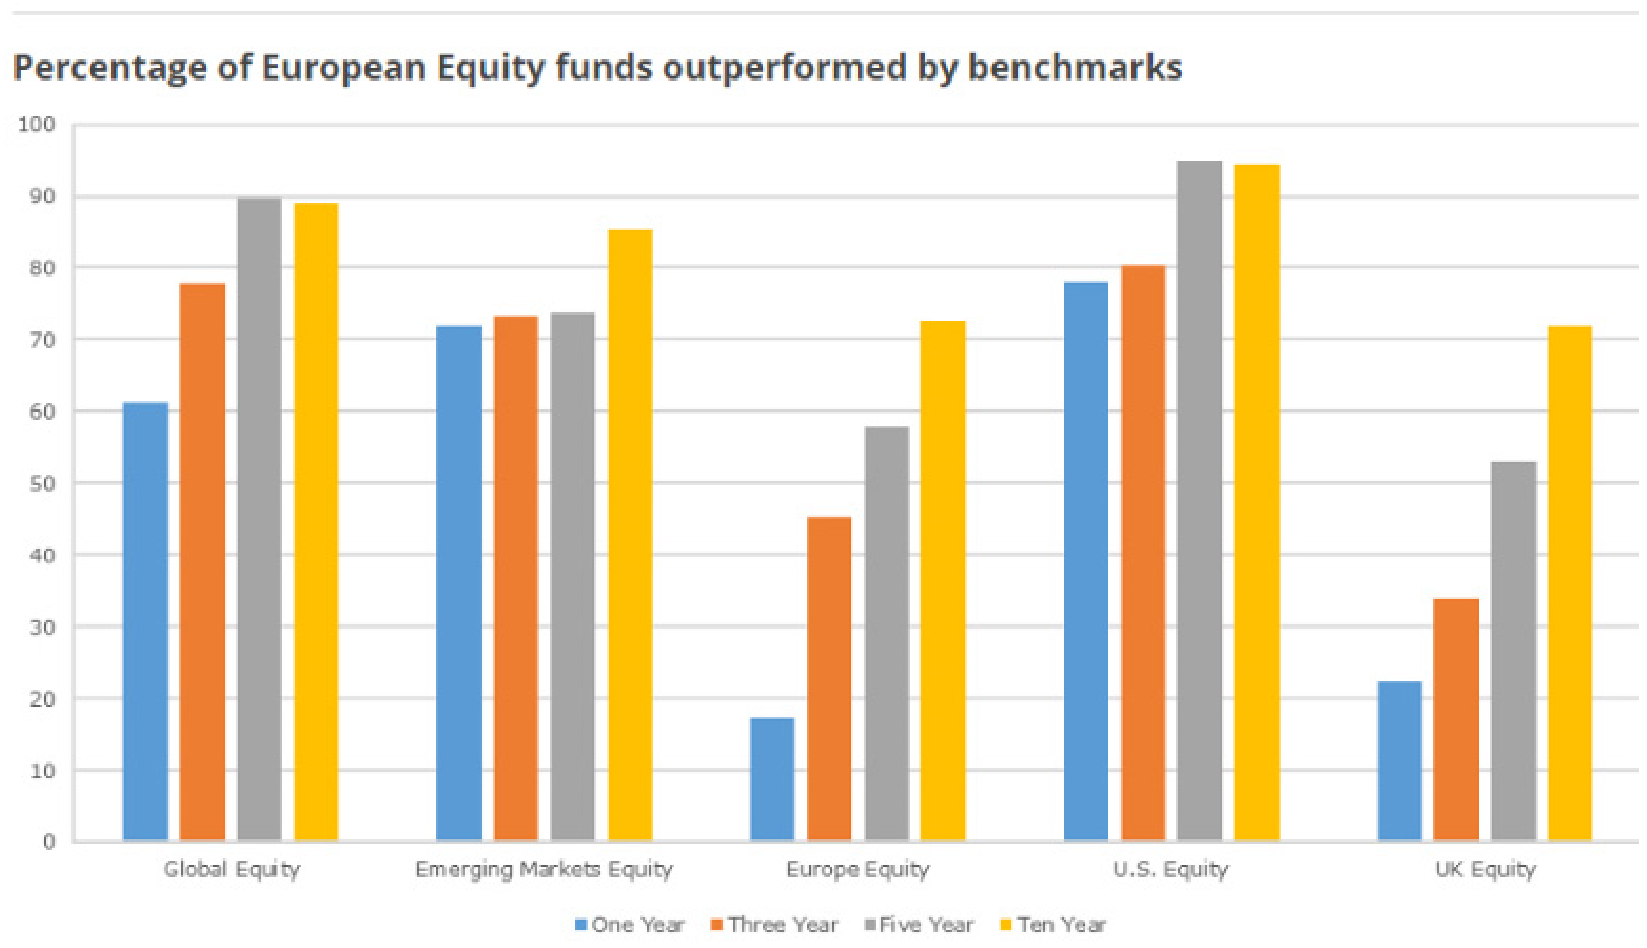
Higher returns: indices have historically provided higher returns than the average of the individual company shares the index is comprised of. This is a result of the fact that the different equities an index is comprised of is weighted. So, historically, the chances are that investing in the index will return greater profits than investing the same sum of money in shares of each of the companies that form the index. This is further demonstrated by the fact that only a small % of professional fund managers, who create their own portfolio of individual company shares, manage to achieve better returns than the major benchmark indices.
Easier to Research: when you invest in an individual company’s shares you must, or should, thoroughly research that company and the factors likely to influence its share price. Imagine doing this for all 100 companies that form the FTSE 100, or all 500 contained within the S&P 500! When investing in an index, the investor only needs to research the factors likely to influence the whole index’s price movement.
Risk Diversification: investing in indices rather than individual companies negates the risk of particular incidents that can cause a company’s share price to crash that are impossible to predict. A scandal or Act of God such as a fire destroying a production facility can badly damage the fortunes of a particular company and tend to happen without warning. Because that company is only one of a large portfolio of companies making up the index, it won’t hugely impact the value of the whole index.
How to Trade Indices
Indices are usually traded using CFDs (Contracts for Difference) or ETFs (Exchange Traded Funds), financial instruments that mirror the price of the index and mean that an investor does not need to buy all the shares at the weightings that the index is comprised of. Generally, CFDs are used for shorter term trades and when the investor wishes to leverage their position, which is not possible with ETFs. ETFs are more suited to longer term positions on an index and when the investor does not wish to magnify their profits or losses through leveraging.
Index Value Influences
Trading indices involves identifying and understanding the factors that influence the price direction of indices, which are different to those which shape the price of individual companies’ share prices. These factors will also vary from index to index, depending upon the nature of the market or sector the index represents. For example, the FTSE 100 is largely comprised of international companies that trade internationally and whose earnings come from a variety of different geographical regions. The FTSE 250, comprised of the 101st to 350th largest companies listed on the London Stock Exchange, is much more tied to earnings derived from the domestic market. As such, the FTSE 100 is mainly influenced by the wider world economy and the FTSE 250 by the domestic British economy. Because indices track the wider financial markets rather than the health of individual companies, they are most strongly influenced by macroeconomic factors influencing the geographies the companies that form the index derive their revenues.
ECONOMIC DATA Indices with a heavy focus on a particular national economy, such as the FTSE 250, will be strongly influenced by economic data considered to reflect the health of that economy. GDP growth, employment statistics, the property market and the data that goes towards those such as production, investment, unemployment claims and new building permit issues all influence indices.
CURRENCY MOVEMENTS The relative strength or weakness of the national currency of the country the index is based is a strong influence on its direction. Indices reflecting export-oriented economies will benefit if the national currency depreciates, as this will increase the competitiveness of the majority of its companies. If an index has a heavy presence of companies that sell to foreign markets, a weaker local currency will mean income and profits earned abroad but reported in the home nation currency will be improved by the exchange rate. This was recently the case for the FTSE 100 after GBP lost value following the pro-Brexit referendum vote in June.
Inversely, for indices that represent economies which are net-importers, a stronger national currency will boost more companies as buying raw materials and other imported goods or services will be comparatively cheaper.
COMMODITY PRICES Commodity prices will be a stronger or weaker influence on an index depending upon the activity of the companies that form its constituents and the national economy that the companies earn the majority of their revenue from. Because the FTSE 100 has a heavy weighting towards international oil and mining companies, commodity price movement strongly affect the costs, revenues and profits of those companies and thus the index itself.
Indices representing national economies with a strong dependency on commodities and commodities-focuses companies, such as Australia and Canada, will also of course be particularly influenced by changes in commodity prices.
SECTOR PERFORMANCE Not all indices represent national economies and some are made up of companies from a particular sector, often listed on stock exchanges in different companies. The S&P Global Mining Index and the NASDAQ Biotechnology Index are examples. Other indices may have a large number of companies from a particular sector and will be more influenced by the general health of that sector than by those other constituent companies are in. The FTSE 100 has a lot of energy, commodities and banks so is more heavily influenced by the performance of those sectors than others, such as manufacturing. The NASDAQ has a lot of technology companies so the fortunes of the technology sector has a stronger influence on the index than it would on others.
POLITICS How stable the political landscape of the nation the companies making up the index make the majority of their revenue in is also very important as this as viewed as a crucial component to the future wellbeing of country’s economy. Significant political changes and events, recent examples being the Brexit vote in the UK and Donald Trump’s election as president of the U.S.A, usually have a significant influence on indices.
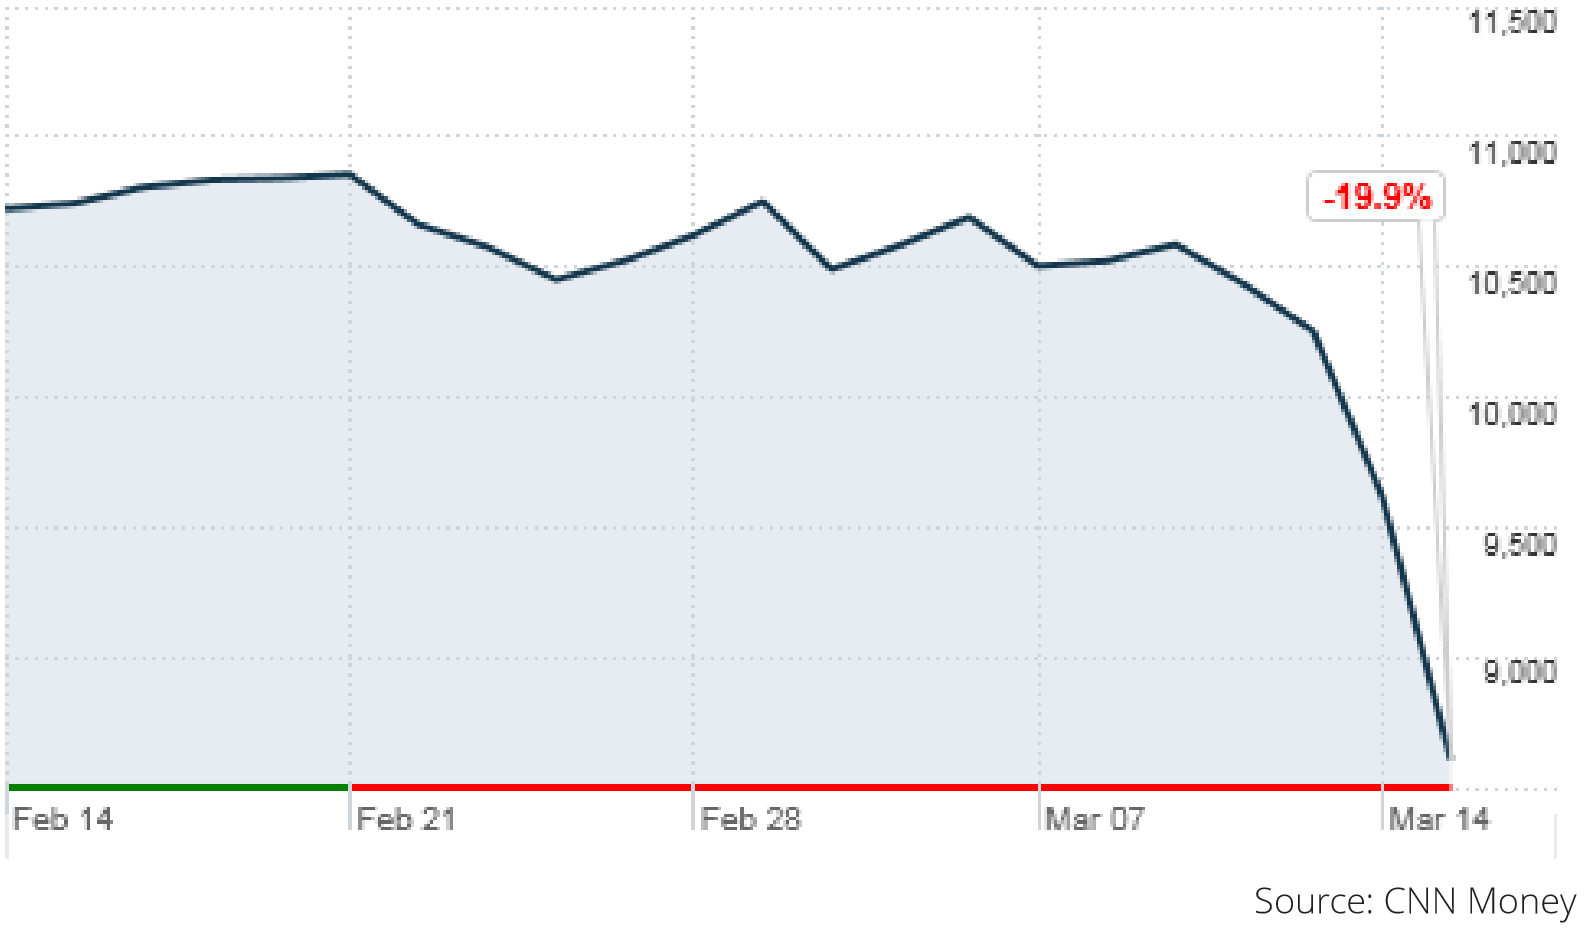
NATURAL DISASTERS, WAR AND TERRORISM All factors that will have significantly adverse effects on the local economy that they affect, major national disasters, war and terrorism have a strong influence on indices focused on the region they are local to. Because they will unavoidably reduce economic activity for a significant period of time, news or the expectation of any of these occurrences will have an impact on indices. The chart below illustrates the impact on Japan’s benchmark Nikkei 225 index following the March 11 earthquake and tsunami.
SENTIMENT At least in the short term, sentiment is a powerful influence on the movement of indices. Depending upon whether general investor sentiment is positive or negative, empirical studies demonstrate that investors will react to the same information differently. In a bull market where investors are buying shares and pushing up prices, lukewarm economic data may be looked upon with a ‘glass half full’ mentality and not dampen spirits particularly. In a bear market a ‘glass half empty’ mentality is more likely to take hold and lead to investors getting nervous and selling, pushing prices down.
How Different Indices are Correlated
Of course, the advance of globalization means that the world’s national economies, financial markets and politics are more inter-connected than ever before. International trade and markets mean that fluctuations of economic performance in one part of the world, currency movements, commodity prices and political partnerships and squabbles have a ‘butterfly affect’ that ripples out. This can clearly be seen through the correlation of indices representing different national economies and sectors. Perhaps the single greatest influence on value fluctuations of an index is how the other indices it is correlated to, to a greater or lesser extent, are behaving. The oft complex matrix of index correlation is something that index traders are having to become increasingly aware of.
In the past, traders invested in different national and sector indices to diversify risk. The logic was that if the U.S. or UK markets were going through a period of unpredictable volatility or a slump, German, Japanese or developing market indices would be performing well. Diversifying capital by investing it in different indices smoothed out returns and was a valuable hedging strategy.
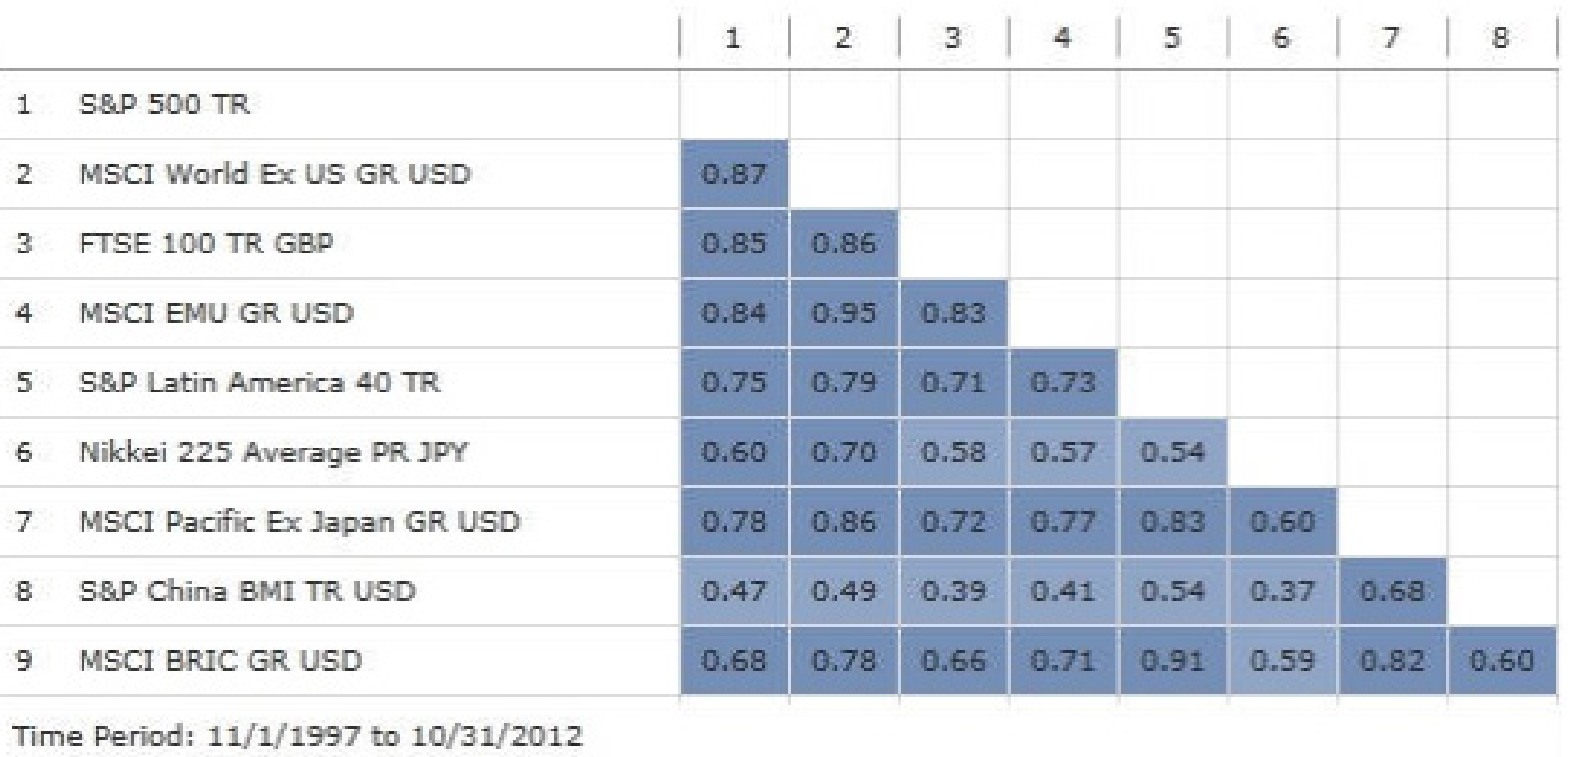
While this is still the case to some extent, statistical evidence demonstrates that the performance of different indices is becoming increasingly correlated. A study conducted by financial markets data company Morningstar illustrates this well. The table below illustrates how closely correlated different indices around the world were between 1997 and 2012, with 1 indicating perfect correlation and 0 a complete absence of correlation. We can see that over the period in question, indices representing the financial markets of China, Japan and the BRIC countries showed relatively low correlation with the UK’s FTSE 100 over the whole 15-year period.
The next table shows correlation levels over the last year of the statistics, 2011-2012. It shows that over that period correlation has tightened considerably.
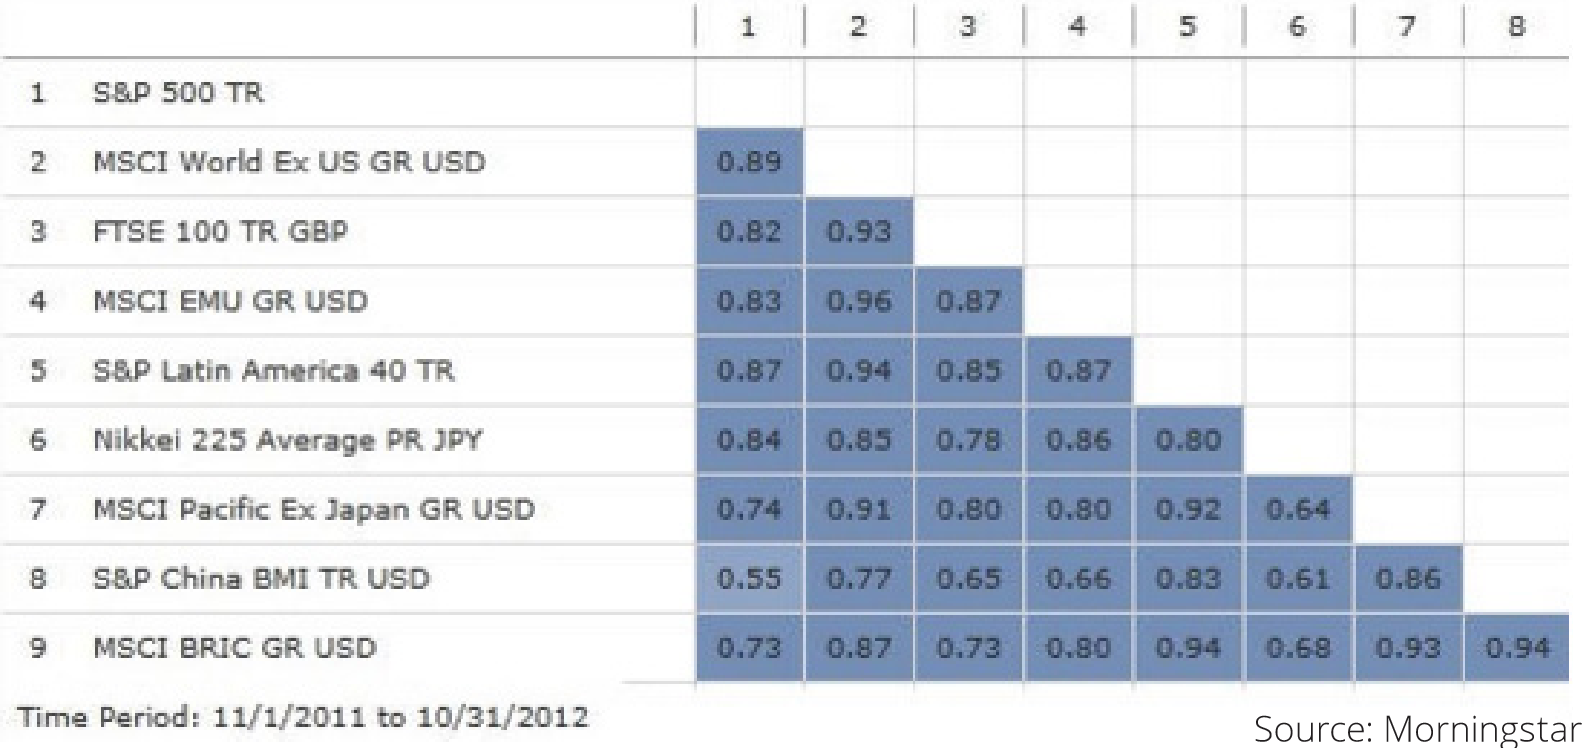
A third table showing the last 5 years of the 15 illustrates that this is a developing tendency and not simply a one-year aberration.

This increasing correlation is a direct result of globalisation and the interconnectedness of the world economy. Researching and understanding the extent to which and ways different indices are correlated is now a crucial component to researching indices when investing in them.
Index Trading Strategies
Well-developed trading strategies are often complex and will take new traders time to get-to-grips with and employ with consistent success. Any kind of trading or investing involves education and ongoing research. While it is impossible to go into detail on specific trading strategies in any depth here, we will take a look at the three main kinds of trading strategy. Experienced traders will employ strategies that combine these three different categories of information.
Long Term Fundamentals Analysis
As covered, indices are heavily influenced by factors such as national economies, politics, currency movements, commodities prices and sector performance. Looking at the underlying factors that underpin those influences can provide valuable clues as to their longer term prospects and, therefore, influence on indices. For example, a national index might be performing well at present but economic data is coming out suggesting that things might be moving in a negative direction. Gradually increasing unemployment or falling consumer spending can indicate a trend that, if continued, will impact a country’s financial markets longer term. Is a country that was at war now at peace and likely to increase its oil production and increase global supplies?
Of course, to be most successful it is important to spot and correctly identify trends in underlying fundamentals that are not yet sufficiently developed to be considered sure and already priced in by the market.
Trading the News
In the shorter term, major news announcements often influence the direction of indices. A statement by the Saudi energy minister supporting an oil output cap will likely send the price of oil up and impact indices particularly influenced by oil price. An announcement on better-than-expected GDP growth will boost an index focused on that country’s market. Learning how influential different kinds of news can be to particular indices and taking advantage of that is a valuable strategy when index trading.
Technical Analysis
Technical analysis is the science, or art, of predicting the movement of indices using mathematical formula based on charts of price movement data. Technical analysis isolates repeating patterns from historical data with the analyst then trying to spot the beginning of a recurrence of those patterns, upon which they will make an assumption on the future trend of an index’s price.
Conclusion
As with any financial instrument, indices have their advantages and disadvantages when it comes to investing in them. Successfully trading indices will require education in more depth on the topics this report has covered in brief and continuing research as markets are constantly shifting and adapting their patterns of behaviour.
Indices are one of the most heavily traded financial instruments globally, with retail and institutional investors alike often preferring them to individual company shares, commodities and FX due to their perceived higher level of predictability.
