


Double Bottom and Double Top
Double bottom and double top are a chart reversal pattern. In other words, the pattern displayed will signal a reversal of the trend. Below we have explained how to identify these chart reversal patterns.
Double Top
A double top is a bearish reversal pattern. As the name suggest the financial asset makes a double peak and thereafter it starts its bearish move. However there is more to the concept than the name suggests. Here is a checklist that needs to be approved before we confirm that a double top has been made:
- Prior Trend
- Peaks
- Support level
- Projection
For a double top the prior trend has to be bullish. After the prior trend has been identified, the first peak must be established. After the first peak has been made, we should see the sellers coming in. An increase in selling volume results in a decline of the asset price. We should then expect a bounce in the assets price. The buying volume (buyers) will exceed the selling volume (sellers) resulting in a second peak. This second peak should be at the same level as the first peak and the height of the two peaks becomes our resistance level. When the asset bounced after a decline this becomes our support level.
After the second peak, we should see a decline in the asset’s price. If the asset breaks the support level then we should see a further decline in the asset’s value. After this break, the support level becomes a resistance level. If the asset does not break the support level then we see a failure double top. Images are always better than words when understanding a new concept hence we have included a diagram.
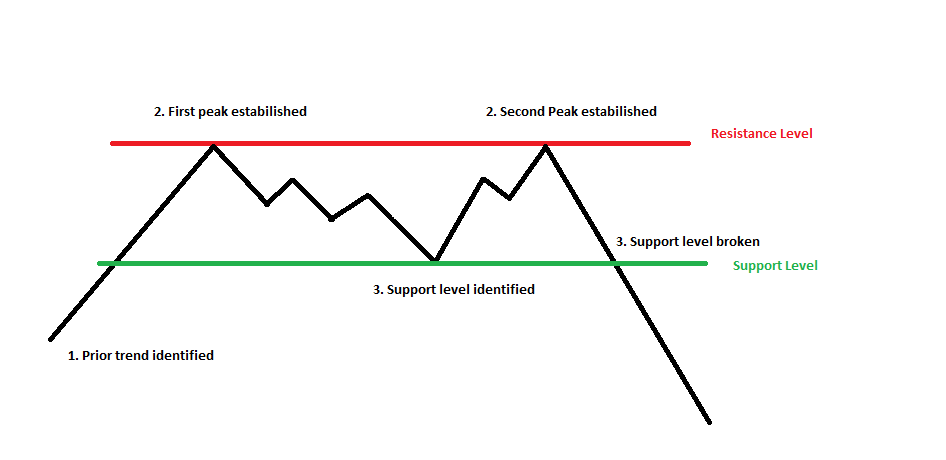 The projection of the double top can easily be calculated. The distance between the resistance and support level will give us an idea of the projection level. The distance will then be subtracted from the support level which will lead us to our projection level.
Double Bottom
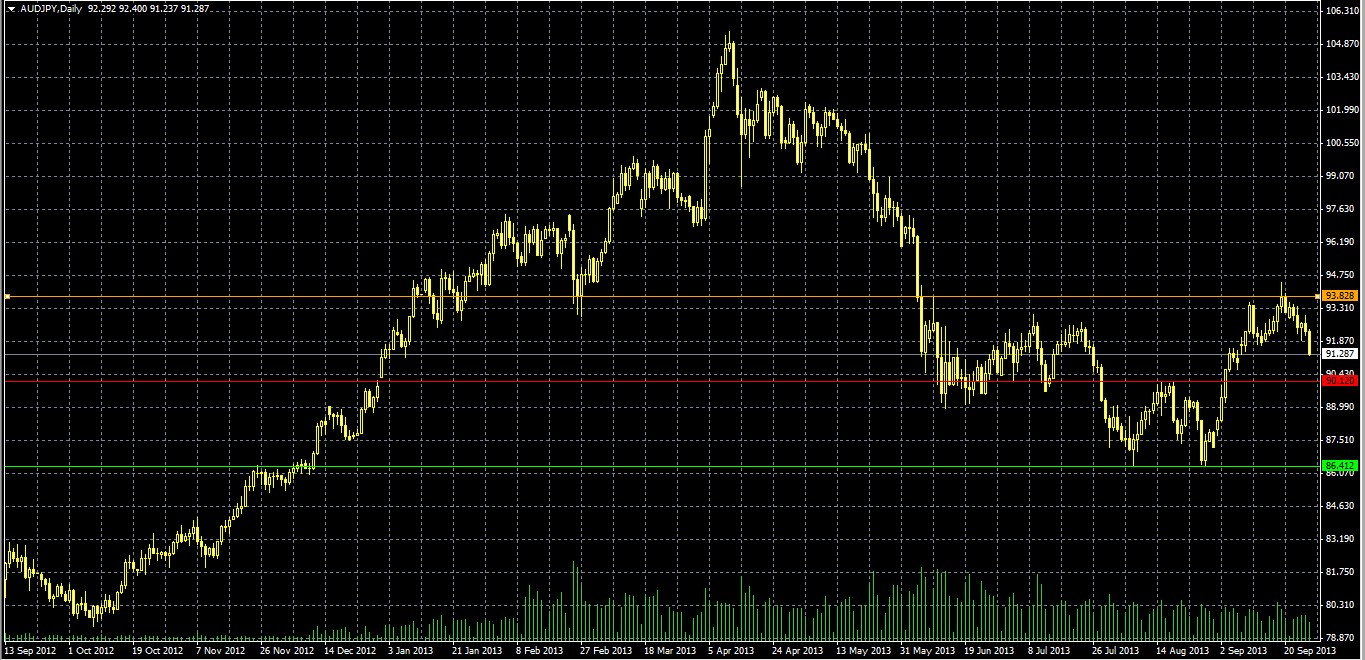
A double bottom is similar to a double top. As the name suggest the financial asset makes a double trough and thereafter it starts its bullish move. We have a chart displayed below which should explain the concept.
We use a similar checklist as above but with a few changes.
- Prior Trend
- Troughs
- Resistance level
- Projection
For a double bottom the prior trend has to be bearish. After the prior trend has been identified the first trough must be established. After the first trough has been made we should see the buyers coming in. An increase in buying volume results in an increase of the assets price. This results in a bounce in the asset’s price. Selling volume (sellers) exceeds the buying volume (buying) resulting in a second trough. This second trough should be at the same level as the first trough and the height of the two troughs becomes our support level (green line). In addition when the asset bounced after the uptrend this became our resistance level (red line).
After the second trough, we should see an uptrend in the asset’s price. If the asset breaks the resistance level then we should see a further rise in the asset’s value. After this break, this resistance level becomes a support level. If the asset does not break the resistance level, then we see a failure double bottom.
The projection of the double bottom can easily be calculated. The distance between the resistance and support level will give us an idea of what our projection will be. The distance will then be added from the resistance level which will lead us to our projection level (orange line).
It is important to note that the chart pattern can fail; therefore it is best to use other indicators and fundamental analysis to have a better view of the market. It is important that you do as much research as you can as this will help you trade better.
