


An introduction to Fibonacci Retracements
Fibonacci retracements are derived from the Fibonacci sequence (The Rabbit Problem), Fibonacci was an 11th century Italian mathematician and now we use his sequence in financial markets. It is otherwise known as the ‘law of nature’ as it can be seen in the circumference of sunflower seed, paintings and in the human body.
In the financial world, Fibonacci retracements are used to find support and resistance levels and to find potential reversals for a financial asset. A Fibonacci retracement is applied to the graph by choosing the Fibonacci retracement tool and applying it to two data points on the chart. One of these data points should be a swing high and the other being a swing low. A swing high is when a candlestick has a higher high then the predecessor candlestick and successor candlestick. A swing low is when a candlestick has a lower low then its predecessor and successor candlestick. Once we have found the swing high and swing low, we then proceed to draw a Fibonacci retracement from these two points.
The line that would be drawn from these two points is divided using the Fibonacci ratios (calculated from the Fibonacci sequence). These will tell us what the support and resistance levels are. You will notice when drawing a Fibonacci retracement on your graph there are percentages from 0.0% to 100%, 0.0% is where you should start you retracement so if you want to analyse the retracement during the uptrend then you start from a swing low to a swing high. Fibonacci retracements can be used successively at different points on the graph. In addition we can use Fibonacci retracements with candlestick patterns.
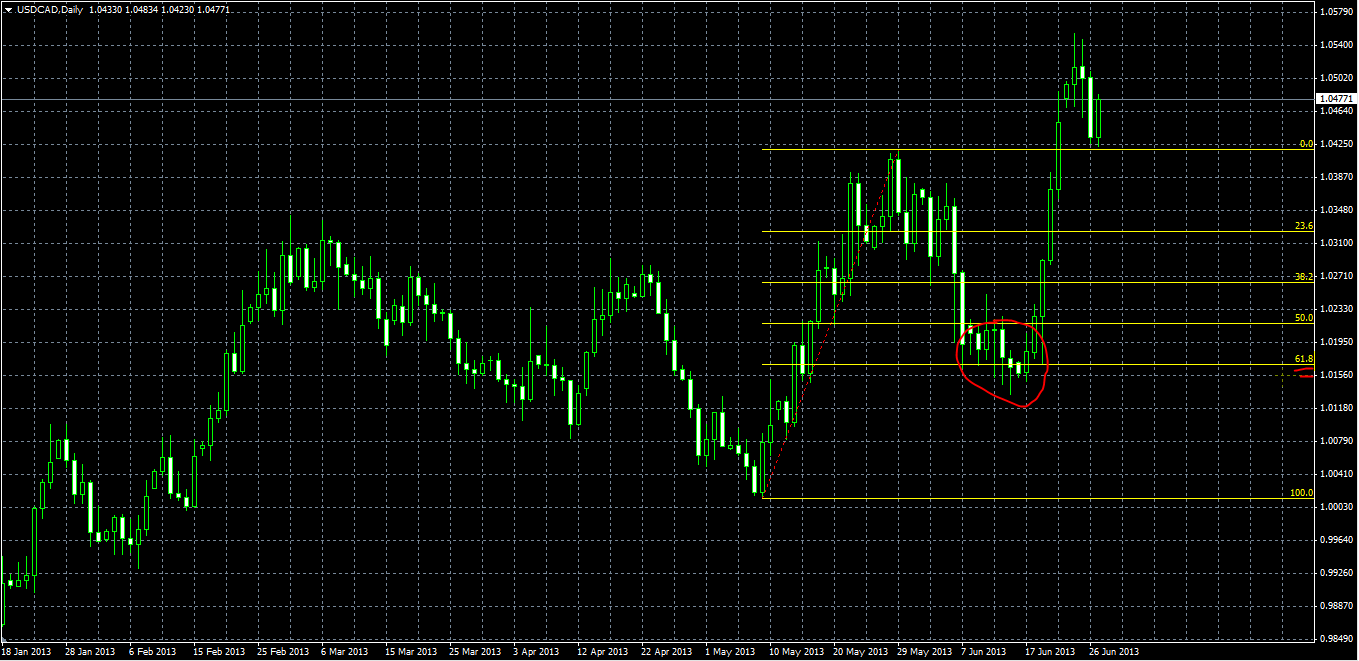
We have highlighted the area where the pair AUD/USD, has found support after the retracement at the 61.8%, and thus when the pair finds support, it would be a good buying opportunity. This is an example of a golden retracement, as this is the inverse of the golden ratio. However it is important to remember that other traders around the world are looking at the same chart and may have drawn different Fibonacci retracement and thus sometimes Fibonacci fails. In other words Fibonacci retracement is related to Human psychology.
Fibonacci retracements as previously stated can be used to determine when to enter/exit the market. So it is ideal to look at past price movement, where was their resistance and support, as this may be the same level that the Fibonacci retracement is giving you.
When a financial asset gains momentum, support and resistance levels can be broken, so you should use caution when using Fibonacci levels. Fibonacci retracements should be used in conjunction with other indicators and fundamentals. This will reduce your losses considerably, as you will be looking at the bigger picture.
