Head and Shoulders
Drawing a Mid-line on a head and shoulders pattern
The mid line is probably the most important part of a head and shoulders pattern. It shows you the exact point to sell the shares and also is used when calculating how low the head and shoulder formation will send the share price.
When drawing a mid-line on a head and shoulders you should generally refer to what we taught you on the “ascending buy line” tutorial. You want to connect as many lows as you can on the lows of the moves which formed the head and shoulders.
⇑ ⇑ ⇑ ⇑ Head and Shoulders
In general, you are drawing a “buy line” for the head and shoulders, only this is not an ordinary buy line you would use to buy the shares, it’s a buy line you expect to get broken and when/if it does get broken – you use that as a sell signal.
The chart below shows an example of a mid-line on a head and shoulders pattern. We have placed the line the way we have as it is a line that connects the most amount of lows as possible.
Familiarise yourself with how we drew this line as you will be drawing one at the end of this tutorial!
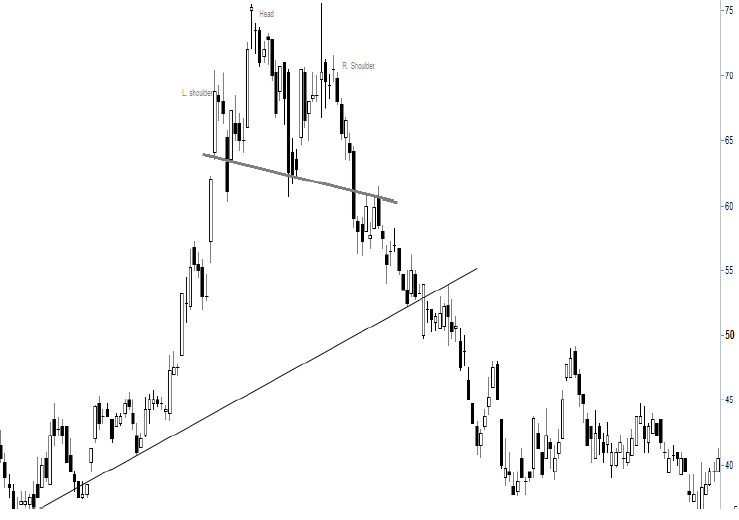
A break of the mid-line is the first sell signal a head and shoulders formation gives you. If you hold shares in a company that has a break of a mid-line on a head and shoulders formation that is the final sell signal that you will get.
Let’s not forget that the higher the right shoulder the earlier the sell signal is generated. If you have a sloped mid-line with a downwards gradient then you will get a delayed sell signal.
The mid-line at the top usually slopes slightly upward. Sometimes, it is horizontal. Either way it doesn’t make too much of a difference. Rarely the mid-line will slope downwards. This slope is a sign of market weakness. This is a mixed blessing as the trader has to wait longer for a sell signal as the sell signal occurs later and after much of the move has already taken place.
So a higher sloped shoulder will give you a better trade providing the break of the mid-line is confirmed. A rising neckline is a sign of greater market strength but does give sell signals much earlier.
As with violations of other buy and sell lines, we require TWO CLOSES below a mid-line for it to be confirmed as broken. This – over time, will ensure that we do not get caught out on false signals.
We have placed some arrows on the chart below – you should consider these to draw in a mid line for this pattern.
Task Time!
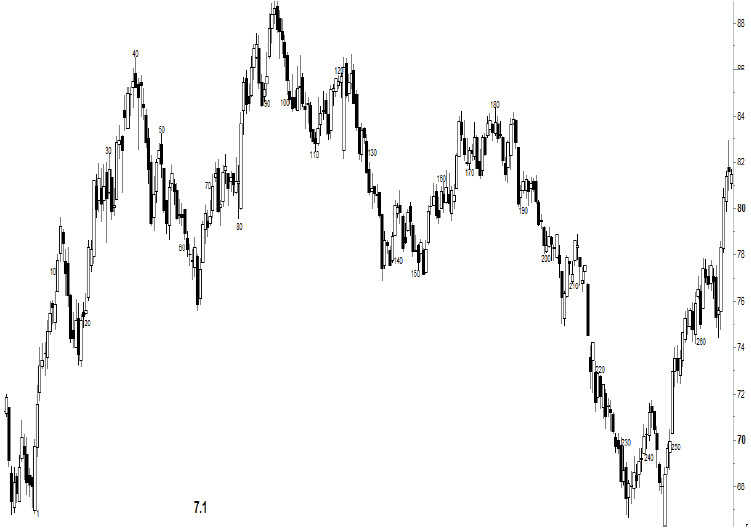
We need you to employ everything that you have learned so far for the following task. There is a chart below showing a very large head and shoulders formation. Your task is to draw the mid-line on that chart.
This is slightly complicated in the fact that there is several potential reference points that you could use to draw a mid-line.
A clue that we would give you is the correct mid-line slopes upwards on this chart. So try to connect a few low points that would ensure the mid-line is getting higher as it is drawn.
The measuring technique that we teach on our eDVD works a treat on this chart and pretty much gave a price target right at the low of the drop.
There is two methods that you can use to get price targets form a head and shoulders pattern, each will give you a slightly different reading and we will show you both methods and show which one we favour and why on our youtube videos.
Remember, this is not a simple task! It may take a few attempts to get the right mid-line. Check your answer against our Audio files.