


Technical Indicators – Moving Averages
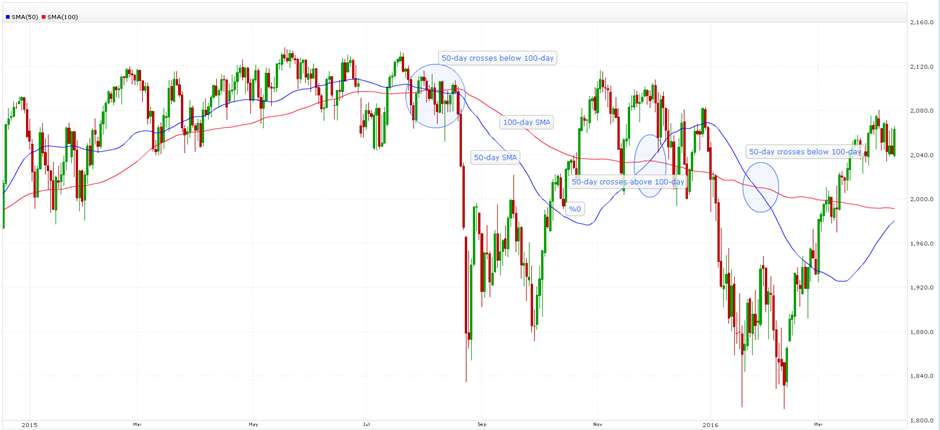
Moving Averages help to smooth out price data so are very useful when interpreting charts. They are lagging indicators as they are based on past prices. Nevertheless, they can help highlight a trend and they can also help identify areas of support and resistance. In addition, many traders look for times when a shorter-term moving average crosses above or below a longer-term moving average as this can signal that a change of trend is occurring and provide the basis of a buy or sell signal. A typical example would be when a 50-day crosses a 100-day. However, few analysts would use this as a trading signal in isolation, and would look for confirmation of a trend reversal from other technical indicators.
Cross-over examples:
Moving Average – Simple
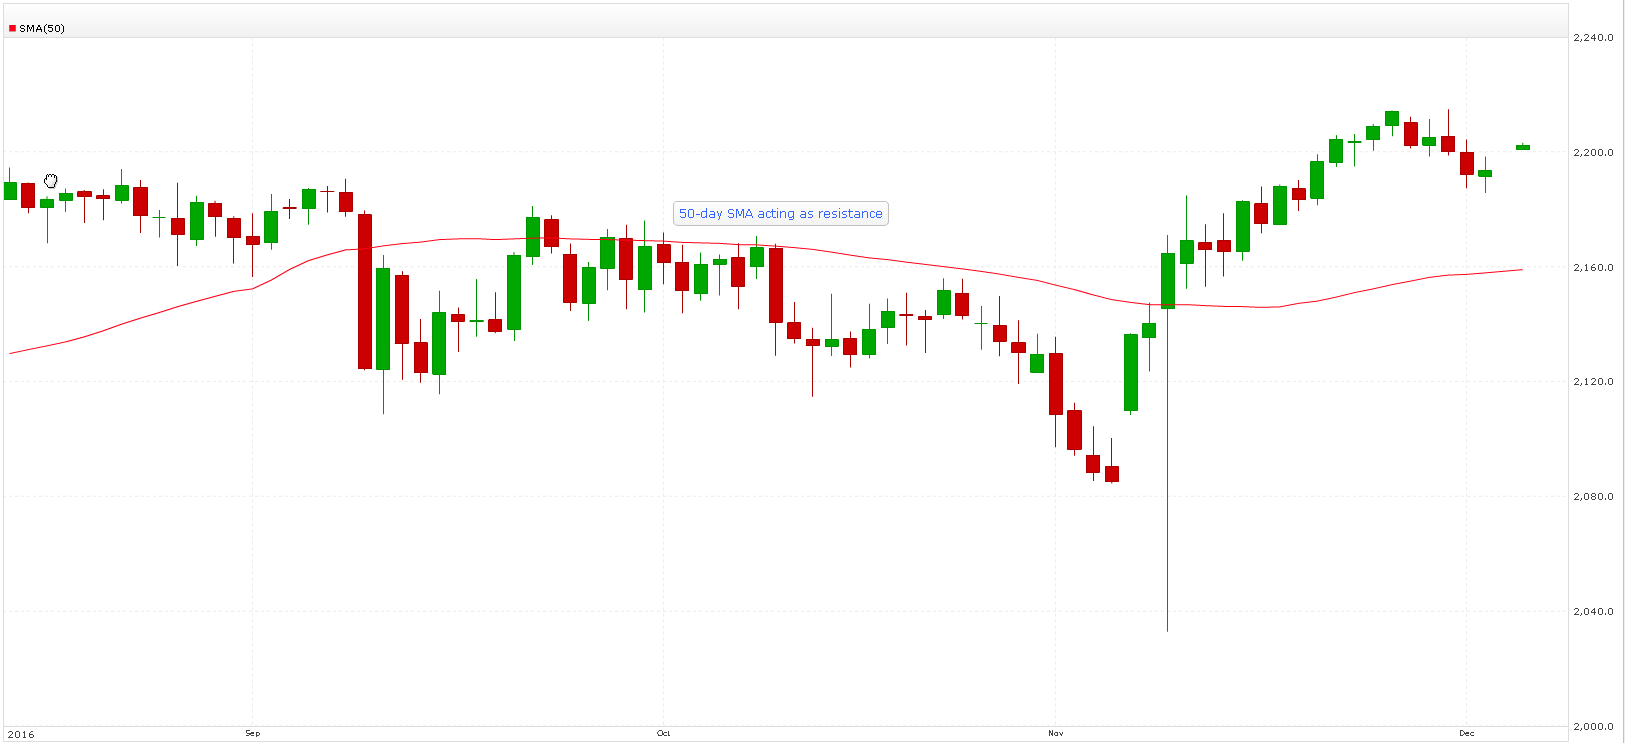
A simple moving average is the sum of closing prices for a certain number of days divided by that number of days. So, a 10-day moving average is the sum of closing prices for 10 days divided by 10. A 200-day moving average is the last 200 daily closes divided by 200. As each day passes, the oldest day’s data is dropped and the newest day’s data added. A chart overlay is then plotted accordingly which helps to smooth out price data. SMAs can be particularly effective when used to identify areas of support and resistance.
Moving Average – Exponential
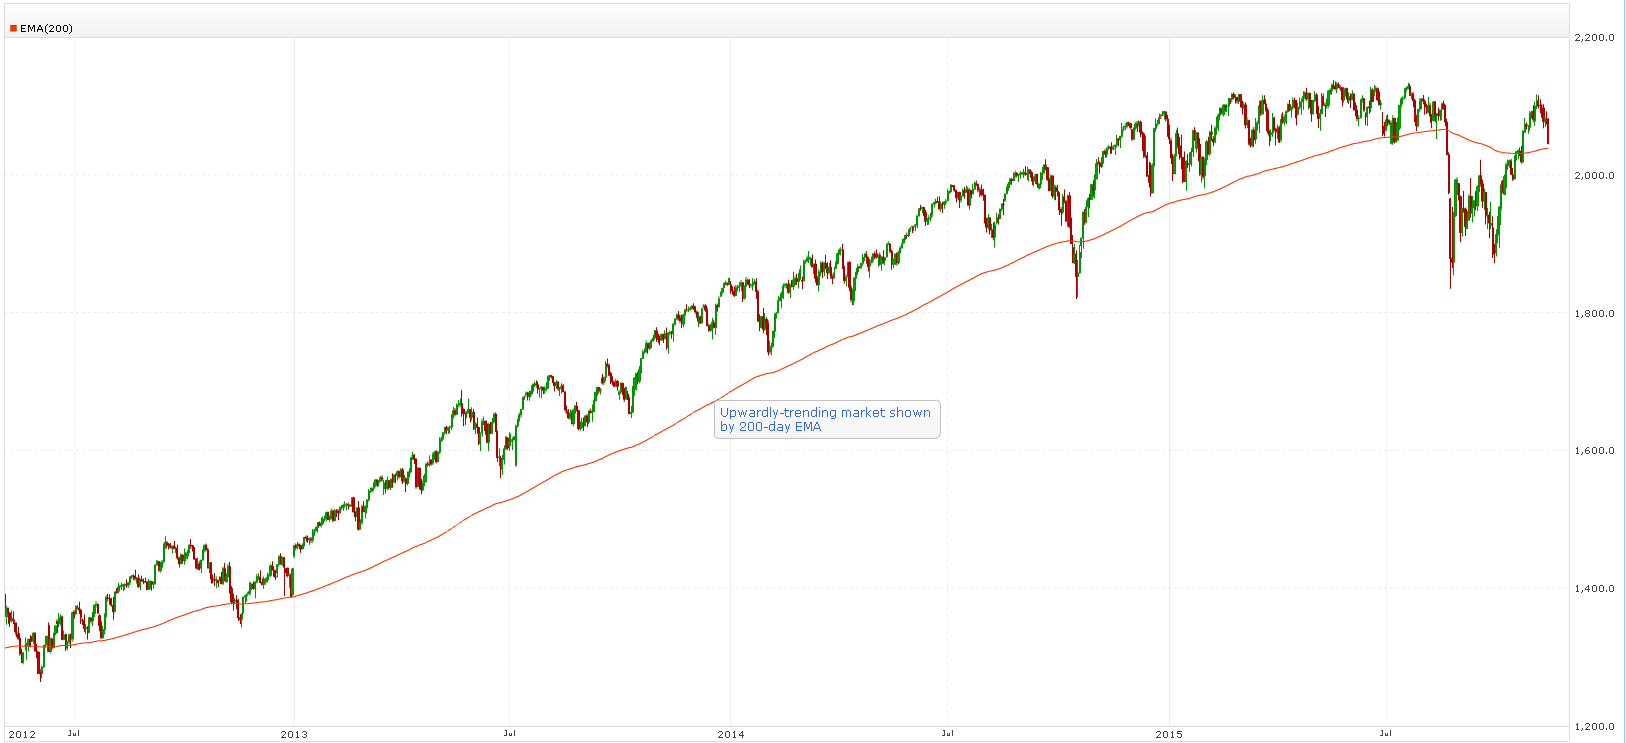
An Exponential Moving Average (EMA) is more complex than a Simple Moving Average (SMA) as it is calculated by assigning greater importance to the most recent data and weighting the calculation accordingly. An EMA takes an SMA as its starting point. Then a weighting multiplier is calculated which varies depending on the time period of the EMA. The multiplier is then used to calculate fresh values for the EMA and a chart overlay is plotted accordingly. EMAs calculated over short time-frames have bigger weighting multipliers than EMAs calculated over long time-frames. EMAs have less lag than SMAs so are better for trend-following. But SMAs tend to work better when used to identify lines of support and resistance.
Moving Average – Weighted
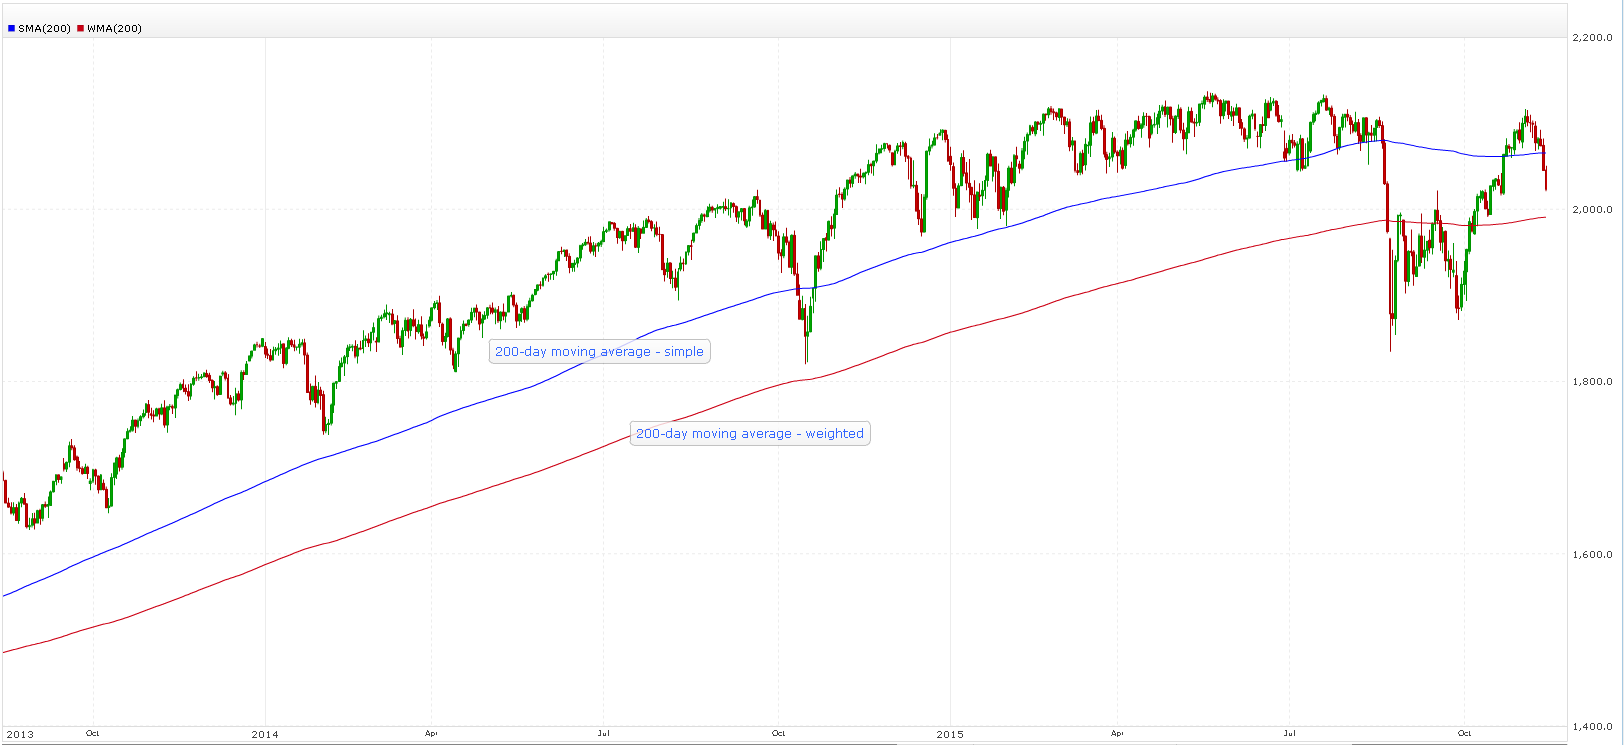
Weighted (WMA) Moving Averages are more complex than Simple Moving Averages (SMA) as they are calculated by assigning greater importance to the most recent closes and weighting the calculation accordingly. As with Exponential Moving Averages (EMAs), they take an SMA as their starting point. But unlike EMAs, rather than manipulating the data with a weighting multiplier, the weighting declines arithmetically as the data gets older. Like EMAs, WMAs have less lag so are better than SMAs for trend-following. But SMAs tend to work better when used to identify lines of support and resistance.
by David Morrison of Spread Co
Spread Co is an execution only service provider. The material on this page is for general information purposes only, and does not take into account your personal circumstances or objectives. Nothing in this material is (or should be considered to be) financial, investment or other advice on which reliance should be placed. No opinion given in the material constitutes a recommendation by Spread Co Ltd or the author that any particular investment, security, transaction or investment strategy is suitable for any specific person.
