


Fundamental Analysis and Technical Analysis
Fundamental Analysis
As the name implies, fundamental analysis takes a look at the basics of any particular stock, and therefore the company behind it. You can find a wealth of details on the official sites, and need to decide which ones are most important to you, so that you can narrow down your stock selection.
The web site uk.finance.yahoo.com has recently been updated, so we will look at how you can use the new arrangement to research company fundamentals. The home page gives you a search box for companies on the left (ignore the big search box at the top of the page, that’s for general Yahoo searches).
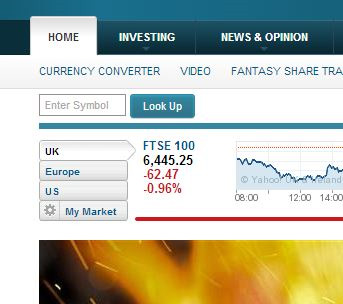
It says “Enter Symbol”, but don’t let that put you off, it will also accept company names if you do not know the symbol used on the stock market. For the sake of example, I started typing Next, and the drop-down gave me the option of clicking on the company Next after the first two letters. You can see from the page below that this took me to Next PLC and that the symbol is actually NXT.L.
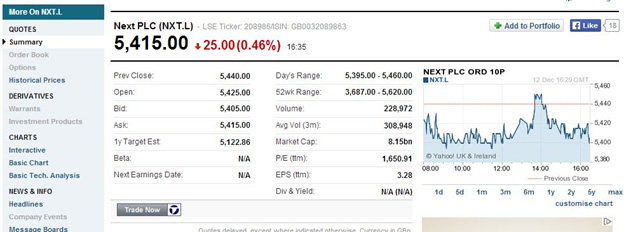
This page shows you all the information you need for a first assessment of the fundamentals, although there is much more available on Yahoo! when you want to look in depth. I will talk later about the items in the left-hand column, where you can access much more.
On the left are various prices. The Previous Close refers to the price when the market closed yesterday, and the Open shows the price at start of trading today. The Bid and Ask represent the current price of the stock – the Bid is how much someone wants to pay for it (5405.00 in this case), and the Ask is the price someone else will sell it for right now (5415.00). This shows supply and demand in action. The Bid and Ask prices always have a little difference, as if they were the same buying and selling would happen instantly until they weren’t the same anymore, if you see what I mean. Price is shown in pence, so it is currently around £54 per share.
On the right you can view the day’s and year’s range of prices that have been seen, and the volume of trading, which is the number of shares which changed hands that day. The market cap is £8.15 billion, this is the number of total shares in the market times the share price.
The next number is one of the more interesting ones. It is called the P/E ratio which is a number studied by many investors. However, Yahoo seem to have got the calculation wrong with this latest web site update (it may be corrected by the time you visit the site). It is shown as 1650.91, but it should really be 16.5 based on the numbers. P/E stands for Price/Earnings, and the number is a comparison of the stock price to the annual earnings.
As you can see, the next line is EPS, which stands for earnings per share. This is recorded as 3.28, and is actually £3.28. This is where the problem with Yahoo’s figures lies, as all the other prices are expressed in pence per share.
Anyway, Yahoo has divided the share price by the earnings to get the P/E ratio. The P/E ratio is typically around 15, give or take a couple, for the shares of most established companies, and calculating this allows you to compare different companies’ share prices to how much money they are making. It is usually one of the first things looked at by people doing fundamental analysis.
If you look at the left column on the page, you will see that you can get access to much more data, depending how you want to analyze the company’s figures. You can get news, price charts, balance sheet, income data, and even analyst opinions, though as mentioned before, you should treat these carefully. The only handicap you will note with free information from web sites such as this is that the stock prices are typically delayed 15 or 20 min. This is of little importance to the investor, but would matter to a trader.
If you are interested in looking at a company’s financials, and exploring the fundamental factors affecting the share price, you should read the company’s annual report which will typically go into much more depth on the way that the Board sees the future. This will indicate in what directions the board would expand the company’s activities, and give you further reason to invest or not.
While all these fundamental numbers are important in themselves, part of fundamental analysis is comparing companies that are in a similar market sector to see which one appears to be undervalued in comparison to the others. You can pull up similar reports on every company which you’re interested, and compare the numbers one by one. While quality of management is an important factor, differences in numerical values can shed a lot of light on which companies are looking ripe for investment.
If you are taking the long view, then fundamental analysis is of major importance. The chief problem with fundamental analysis is that it says very little about timing. It is all very well to look at the numbers and figure out that a company is “worth” more, in the sense that its developments, sales, and management will increase its dividend and/or cause the stock to rise in price. How many other investors are looking at the same information as you and coming to the same conclusion at the same time?
If they are not, and the market as a whole does not realise what you think you have identified, then there is no reason that the stock price will change. You need supply and demand to work to change the stock price, and you can’t force that to happen on your timing. The price depends on what the other players in the market believe. The value of a stock is reflected in the stock price, but only to the extent that the majority of the market players are in accord and acting appropriately.
Technical Analysis
As previously mentioned, technical analysis is widely used by traders, and tries to identify in detail the market sentiment, that is the way that other market participants are viewing the stock. The stock price changes with supply and demand, so understanding how other traders are thinking should help you to make short term gains as the price fluctuates. In this way, it is in stark contrast to fundamental analysis. The technical analyst does not really care what the P/E ratio is and in many cases won’t even try to find it out, as it is irrelevant when you’re trying to predict the price movement based on what other traders are doing.
If you look at any stock price chart, you will see that there are usually many opportunities where trading in and out of a stock can achieve significant gains, provided that you can get the timing right. As I pointed out a while ago, this means that traders generally make their profit at the expense of other traders (or investors) who are the wrong side of the fluctuations. The fact is that the majority of people who try trading give up within six months as they don’t make any money. Trading would be a zero sum game, but for the fact that the “enablers”, i.e. the brokers and dealers, have to take some money to pay for their services. As charges are not uniform, and various methods of trading can be charged differently, it pays to examine how much your particular arrangement will cost.
Technical analysis requires work, but it does not require being a nerd or a mathematical genius. In fact, it hardly requires any technical ability at all nowadays, as calculations are performed by computers and all you have to do is interpret shapes or patterns that are generated for you. Although you can still exercise skill and effort in deciding which shapes and values to watch out for, as mentioned previously successful trading depends to a great extent on you developing the right mental outlook.
The whole principle or belief behind technical analysis is that you can predict short-term price moves from the way the market has acted up to now. In other words, you try to project the future based on the past. A simple summary would say that you are looking for situations where history has shown a certain outcome is more likely than not, then you base your trading on that expected outcome.
This brings us to one of the basic tenets of the technical analyst, that “people don’t change”, “history repeats itself”, or whatever other way you want to express it. This has been shown to be true, with countless examples in the trading world and also some in the real world, if you choose to think about it. As George Bernard Shaw put it, “We learn from history that we learn nothing from history”, in other words the populace as a whole is condemned to repeat the mistakes of the past. This works to our advantage when we want to identify repetition, as in trading.
You try and use the past to point you in the right direction for the future. Of course you have to be clear what particular aspect of history led to the outcome you require. You will never get exactly the same situation, so you try and pin down which particular factor seems to make a difference the majority of the time.
Another idea of technical analysis is that trends continue until something definite happens to change them. This is summarised in the often-quoted maxim among traders, “Let the trend be your friend”. In other words if the share price is going up, it’s pretty likely it will continue going up. Of course, at some stage it will stop or even come down, but with short-term trading you try and anticipate that event before it happens by looking for the warning signs.
Sometimes the idea of the trend continuing is related to Newton’s Laws of Motion – “an object in motion will keep moving at the same speed in the same direction unless acted upon by an external force” – so what you’re looking for to show you that the trend is about to fail is the presence of an external or disturbing force on the trend.
So how does it work, when you decide to use technical analysis to help you trade? The centre of the analysis is a price chart, and various lines and indicators are calculated and added to the chart by the computer, as commanded by you. There are hundreds to choose from, many with numbers that can be altered to change the characteristics, but if you learn technical analysis you will find that there are many recommendations of indicators and numbers to use, so you have a predictable starting point for your learning.
You either take someone else’s word for it, and go with the indicators and values that someone has suggested, or you use the general ideas and explore for yourself what tools seem to work for the particular security that you are looking at. With such a vast range at your disposal, you can get lost in analysis, in other words “paralysis of analysis”. You need to learn to cut through the complications, and not get swept up in the details in your search for a “perfect” trading system. You will never find a trading system or pattern that is 100% reliable, so in the end you will use your “best guess” values and indicators.
Once you have put your preferred indicators of the chart, you simply have to look for patterns or crossing lines, according to the strategy that you are following. Technical analysis comes down more to a visual art than a number crunching skill. This is where discipline comes in, as sometimes you will find it hard or counter intuitive to follow your system. If the system is a decent one, then you have to learn to commit to it and not second-guess on-the-fly. Inevitably, occasionally when you intuit a certain action which does not comply with your system you will find it works out, against the odds. It can get very difficult to stick with your plan, but usually if you deviate you will regret it later.
In case you think sticking with your plan when trading sounds too easy, you have to realise that there are several problems to technical analysis. One of the first is that technical analysis will never tell you which direction the price is going for certain. All you are doing is increasing your probability of having a winning trade, and you will have a share of losing trades.
Some people find this very hard to accept. They work the charts, and if the charts say the price should go in a certain direction, then they are upset if it doesn’t. They go back over the indicators and their plan, and try to see what they did “wrong”. They may well be confounded in this search, as often they did not do anything wrong, it was just one of those times when the price when the other way.
This is where the mental aspect of trading comes in. You might beat yourself up, allowing a loss to prey on your mind and possibly affect the next things you do. In fact, it is very difficult not to do this, because that is the natural way we think. If and when you study technical analysis, you will find that the mental aspect is just as important as figuring out which indicators to follow.
Just one more point, an unanswered question you may have from the comments above. If you are bound to lose as well as win some trades, how do you make a profit? That is a question that many would-be traders struggle with. The point is, you have to win on average. For example, you might try to have a gain/loss ratio of 2:1 or 3:1. This means that if the trade works out you stand to gain two or three times as much as you think you will lose if the trade doesn’t work. In other words, your winning trades make much more than the amount you might lose. You make sure that you only trade on stocks that appear from analysis to give that opportunity. That way, even if you only won half the time, you would still make money. And your trades will usually be selected with a historical chance of winning more than half the time, even if it is only say 60%.
That is a brief summary of technical analysis, and to learn it you need to spend a lot of time in study, though not much money if you pick up the free course I have written for you. Remember that you need not be overly apprehensive. Technical analysis does not require you to do calculations or even possess a calculator. The computer will represent data for you, and you look for the patterns that have worked before. These patterns cannot predict the future, as they are only based on past events, but they should point you in the right direction the majority of the time.
