


Charts
Price charts are essential for successful spread betting, and I believe this to be true whether you are practising short-term day trading, intermediate-term swing trading, or longer-term position trading.
In addition to the charts provided by the spread betting companies themselves, you will find many other paid-for and free charts provided by third parties. Personally I don’t see the point in paying for charts these days when the spread betting companies provide them as a complementary (additional) and complimentary (free) adjunct to their trading platform services. Not only that, but many of the entirely free sources of financial information on the web – like Yahoo! Finance and Google Finance – provide good charting facilities, and in the case of Google Finance these have been “real-time” charts since 2012 rather than the old-style charts that suffered a 15-minute delay.
This guide contains many examples of price charts, which I have attributed to the providers of those charts wherever possible.
Most if not all of the charting tools allow you to view charts over varying timescales from minutes to months, and they allow you to overlay useful technical indicators such as moving averages.
You can typically display charts in various formats including simple lines and candlesticks. Most spread bettors will use candlestick charts, so it is worth quickly reviewing how a candlestick chart should be interpreted.
In the example chart below, each “candle” represents one trading interval, which might be a day or which could be a shorter interval such as an hour or a minute. The upper and lower “wicks” of each candle indicate the HIGH and LOW prices reached during the interval, and the “body” of each candle indicates the OPEN and CLOSE prices for the period.
Note that when the price closes above the level at which it opened, this “bullish” condition is indicated by a hollow candle body; when the price closes below the level at which it opened, this “bearish” condition is indicated by a filled candle body.
Note also that the open price of each candle should correspond with the close price of the previous candle, unless a “price gap” has occurred.
Trade through Charts
Some spread betting companies provide a facility to “trade through charts” and to visualise your existing positions on those same charts. See how the following ETX Capital chart clearly shows that I had established a position in Enterprise Inns at a price of 29.293p-per-share, that the position moved first into loss (shaded pink) and then into profit (shaded green), and that the current market price is above the level of the stop order that I have successfully trailed to 57p-per-share.
‘Trade Through’ Chart courtesy of ETX Capital
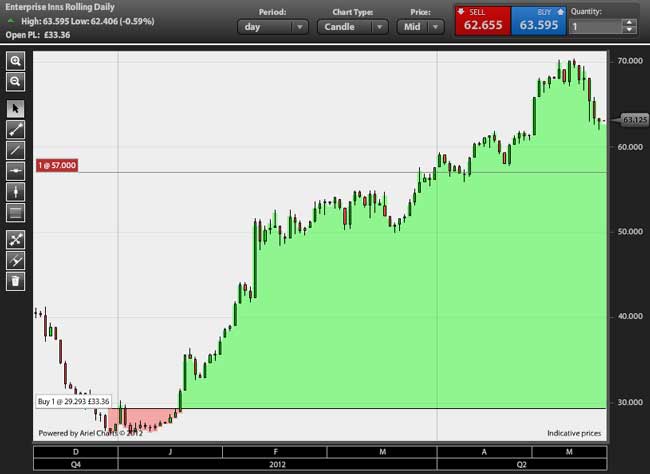
In the above chart you can see that I also have the ability to buy or sell a bet on this stock, for example if I was now inclined to pyramid an additional position now that the price is falling back towards my prevailing stop order level.
ETX Capital is not the only spread betting company to offer a “trade through charts” facility. The following IG Index chart shows that I just opened a long £2-per-point FTSE 100 index position at a price of 5318.6 with a protective stop order placed 15 points below at 5303.6. I’m pleased to see (on the chart) that this spread bet has already moved into profit by £2.
“Trade Through” Chart courtesy of IG Index
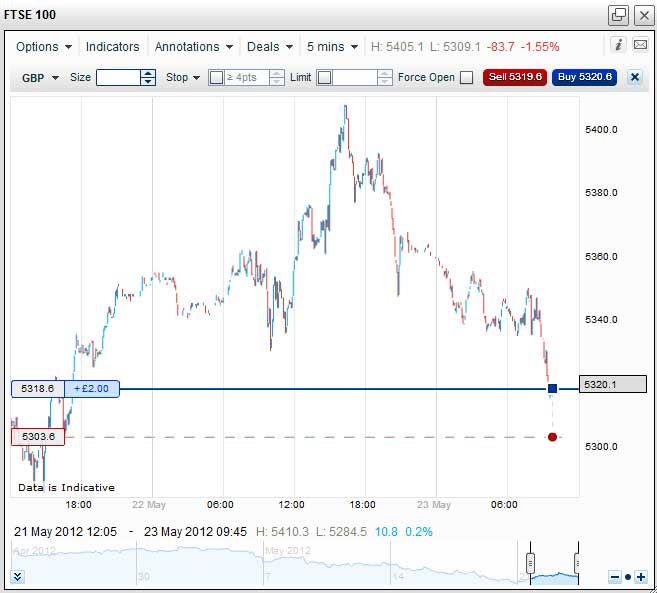
As in the earlier ETX Capital example, this IG Index chart provides a mini trading ticket at the top of the chart that allows me to buy or sell this market (the FTSE 100 index) without leaving the chart.
‘Trade through Charts’, or ‘Charts on Trade Tickets’?
An alternative to allowing trades to be placed from charts is display charts on trade tickets. I have seen this alternative approach on at least stockbroker platform and on some of the spread betting mobile trading apps, and as I write this I have just received an email from Spread Co announcing that their new trading platform will include ‘Charts integrated within trade tickets’.
Spread Betting Companies’ News and Research
In May 2012 Capital Spreads introduced a new Economic Calendar and Market Data portal to their Trading Tools section, which at the time of writing can be accessed by clicking the Trading Tools tab on the Capital Spreads main page. Of course, you need to be logged into a Capital Spreads account in order to utilise the useful content provided in conjunction with the respected financial information provider Digital Look.
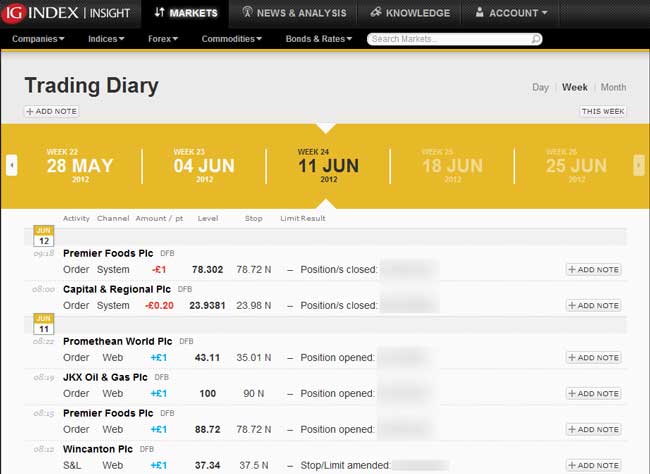
IG Index has a range of research and analysis tools including the INSIGHT portal which – as well as providing access to a range of market analysis tools at the time of writing – also (among many things) allows you to review your trading activity in the form of a daily, weekly, or monthly diary as shown below.
IG INSIGHT screenshot courtesy of IG Index
Financial Web Sites
Besides the spread betting companies’ own news and research portals, don’t forget that there are many entirely free web sites offering financial news, research and commentary.
My favourite financial web sites are Yahoo! Finance and Google Finance, and for those of you who are more “investment” oriented The Motley Fool may be more appropriate.
