Strength of buy Lines
You will be working through tasks based on real Stock Market charts, learning some important points on drawing buy lines and finally drawing you OWN buy lines on a real Stock Market chart!!
⇑ ⇑ ⇑ ⇑ Strength of buy Lines
Just to recap:
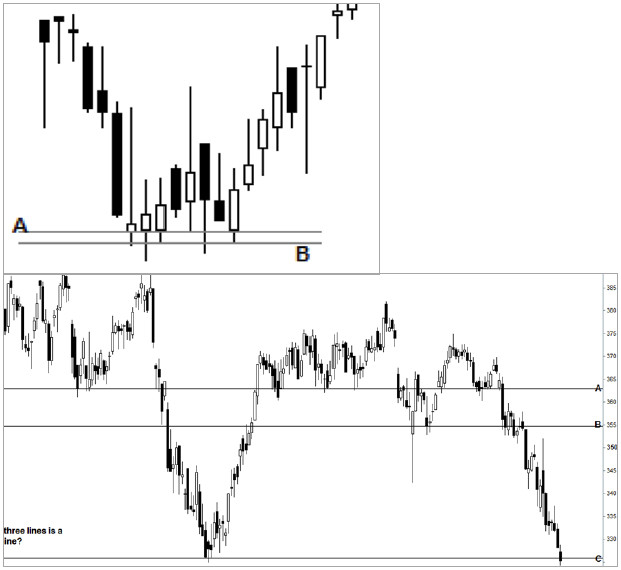
You need to find TWO low points of moves in line with each other to draw a buy line.
However, here comes your first dilemma.
How do we define two LOW points? Do we use the base of the candle body or the base of the wick?
The picture below shows two different buy lines dependent on what technique you use. Which would you say is correct? (The answer can be found on the audio file for this section).
Strength of buy Lines
We can draw buy lines on a chart but is there a way of telling if one is more reliable than another? You bet there is!
We have laid out the most important factors when determining the strength of a buy line:
1) Time = The longer the trend line has been in tact the more important it becomes ( A buy line that has been in effect for 7 months will be more important than one formed over 8 weeks)
2) Number of tests = the number of times a line has been tested increases its strength. A line tested 8 times has proved its validity and is more important than one that has been tested 3 times. So do not put too much faith in newly formed buy lines.
This brings us to a VERY hot tip, the more important a buy line the more important its penetration if the market breaks below it. Very long term trend lines being broken can mean a complete change of trend, a break of a new line can mean just a small pull back.
Let’s not forget that in BEAR markets previous/current supports (buy lines) end up being broken. It’s a characteristic of a market making lower lows. So buy lines will not work very well when a share is continually declining.
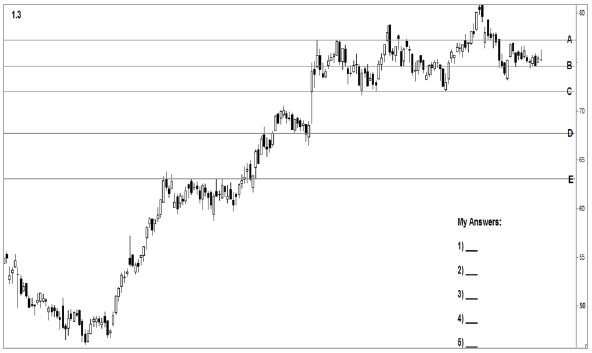
Please turn your attention to the chart below, there are 5 buy lines highlighted, your task is to list them from strongest to weakest using the information above. Answers can be found on the Audio file!
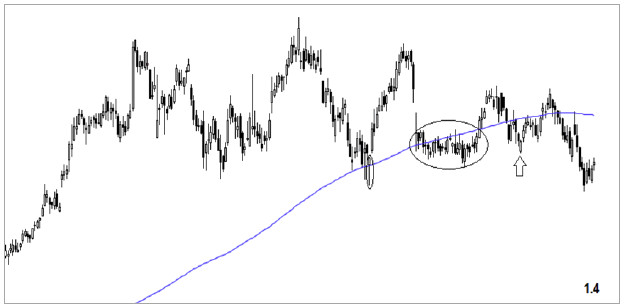
Using everything you have learned so far – draw TWO horizontal buy lines!
To help you we have selected a few tips:
– The first line that you will be drawing should consider areas that the price consolidated at. There is an area near the bottom of this chart where the price held for over a week before rallying upwards.
– The other buy line is a little less obvious however it does sit below the other buy line. There is THREE touches of this line from above it and ONE from below it
Give this exercise a try, it’s the first time you would have had to draw your own buy line and it can be a little tricky with a busy chart such as this one.
Remember, the audio answers will help you however we do advise you give it a go first!
(To give you a helping hand we have circled two candles, one for drawing buy line one and one for buy line two!)
Good luck!!