Descending Trend Lines
Trend Line drawing – when to use those false signals and when to ignore them
So at this stage we know we need to connect as many high points as we can when drawing a sell line. What can complicate this is when we connect several high points and then see some candles (price action) pop their heads above the line that we have drawn for several days. What does this mean for my trend line?
Price action like this can be one of two things:
- A genuine break of a trend line.
- A false break – meaning it starts to break the line, buyers get nervous and the shares fall back under the line.
⇑ ⇑ ⇑ ⇑ Descending Trend Lines
As a trader you will need to adapt to these conditions. Best practice is drawing a line and connecting as many high points as you can and ignore the “false break out” initially. The you can draw another line including connecting the high of candles that have gotten above your line. Look at both lines and decide which one feels right.
Sometimes (especially with newly formed lines) false breakouts actually tell you that the trend line is widening and needs to be redrawn to capture the high of the new move.
As you may have guessed – trend line drawing can take some practice – when you master it you will find trading A LOT easier! We have more on trend line drawing on our youtube channel.
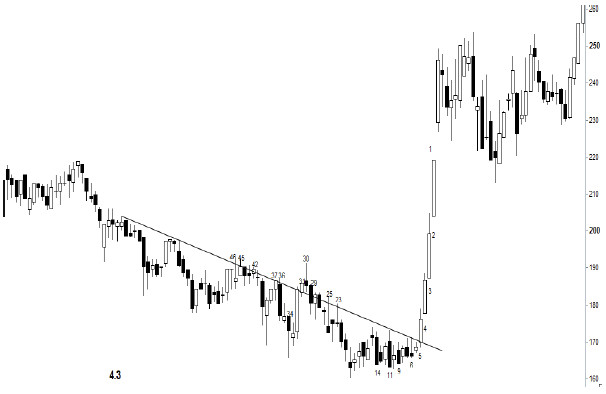
For your next lesson there is two tasks, the first is to determine what high point to select in starting this descending sell line. (This can be quite tricky!) So we have some top tips to help you:
- Remember that it is not always the most obvious high point that you need to select to draw a descending sell line and (Hint! Hint!) that is the case on this chart too!
- A good starting point is to look at the candles with long spikes on top of them (near where the numbering starts on this chart).
- A good trader will draw several lines until he is happy that he has the correct one, he can then delete the other lines. Let’s not forget that a buy or sell line drawn incorrectly will give the wrong signals at the wrong prices so practice makes perfect!
The other task for this chart is to start recognising what price action to disregard when drawing your sell line. If you draw this line correctly then there will be a few occasions where candles pop their heads above your line even for a day or two (or three!). This is completely normal and represents a little volatility at a trend line.
Remember – a good sell line will connect as many high points as it can – it DOES NOT have to use the extreme high points.
You may find this task slightly easier if you put yourself in the mindset of “I need to connect as many candlestick spikes as I can”
Good luck!
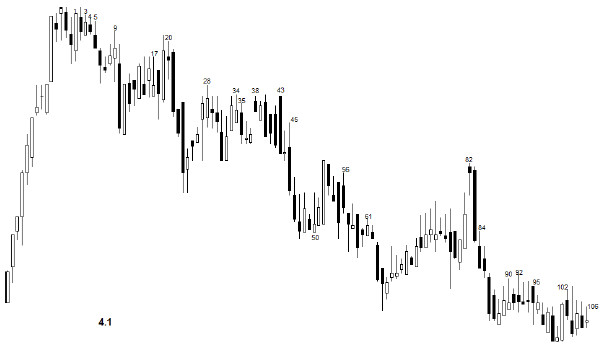
Your final task for this series is as follows:
You are watching this share – you are aware that the share is in a down trend making lower lows. As a good trader you remain patient and refuse to buy the shares whilst they trade underneath a sell line that you have placed on the chart.
The candles are numbered from the right hand side on this chart. You must select the candle that gave a buy signal by breaking the sell line.
Remember what you learned in the ascending buy line eBook. The two day rule works on ALL trend lines, whether they are buy lines or sell lines!
One thing to note is sometimes even the best traders do get caught out when the market gives a buy signal that fails. You may get a buy signal – buy the shares, and then see the shares drop back under the sell line.
This is proof that no single piece of technical analysis will work 100% of the time. This is why we use the two day rule so that over time we will make good trades more often than not and ignore a lot of the markets false breaks of trend lines.
Remember after completion of this task to check your answers against the Audio Answers!