


The Importance of Volume as a Technical Indicator
Hi everyone,
In my previous posts, particularly the Chart of the Week posts, I have tried to introduce different technical indicators that traders should look out for like trends, double bottoms, higher highs and higher lows, etc. Today I thought I’d take a look at another very important technical indicator that is often overlooked by traders – Volume. In this post I am going to cover a number different trading setups where volume is a key factor in giving weight to the trade you are considering.
Large Volume Adds Significance to Breakouts
For traders who look for stock breakouts (either to the upside or downside) then checking out the trading volume of shares traded on these breakout days is important. Basically if a stock has been trading in a narrow range for a number of weeks or months and then suddenly (over 1-3 days) makes a significant upward or downward movement then this is considered a breakout. The longer the stock has been trading in it’s previous range the more significant any breakout is when it eventually comes. Typically though you should be keeping an eye on stocks that have been trading in a narrow range for approx 10-12 weeks (often referred to as a consolidation pattern or period). During this time when the stock is not really moving in either direction basically we have a stand-off between the bulls and the bears, with neither having enough conviction to force the the stock in a particular direction. However as sure as the amount of money required to bailout the banks will continue to rise one thing is certain with bull / bear stand-offs, sooner or later one of them is going to win the battle and when they do the stock will move. That’s when you need to be ready to make your move. But before you get trigger happy with your trading it is important to make sure your breakout is real and not just a false breakout due to a bout of short covering or just handful of trades going through at prices outside the norm. That’s where the daily trading volume comes into play. If the stock for example has an average daily volume over the previous 3 months of lets say 1 million shares traded and on the day of a perceived breakout to the upside the volume is a mere 300K then you have to be suspicious of it. In this scenario clearly the buyers have not suddenly come out in force to push this stock upwards. Now it may be the case that it takes a few days for whatever news is on the horizon to break and when it does come the stock will continue higher but until you see some serious volume backing up the breakout you have been waiting for then it’s best to bide your time. Regularly breakouts on low volume turn out to be false and within a few days the stock is back in its range. In fact I know many traders would use such low volume breakouts to the upside as a reason to short the stock (or they would buy low volume downside breakouts), in both cases looking for it too fall back into it’s range.
Some Pretty Charts to Look At…
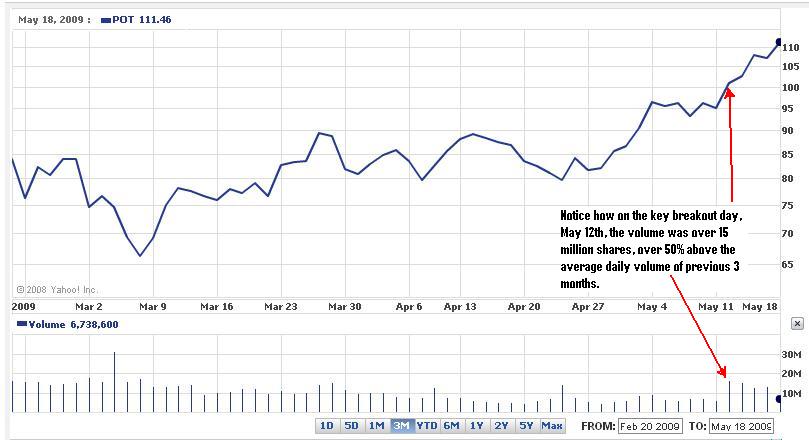
To help back this up I have included a couple of charts. First up is a stock I have been aggressively trading over the last couple of weeks, (when you see the chart you’ll probably guess why!) called Potash (Ticker: POT) who are one of the world’s largest producers of fertilizers. I am not going to go too much into the company itself right now because I think it’s an ideal candidate for a future Chart of the Week post. But for now lets look at the the recent breakout above a key resistance level of approx $95 a share and the part the daily trading volume played in this. The chart below (click to enlarge) is a 3 month chart and over that period the stock had an average daily volume of just under 10.5 million shares traded a day. On the 11th May, the day before it’s significant breakout, the stock closed down about 1% at $94.96 and exactly 5.5 million shares were traded, so well below the average daily volume. Along came the 12th May and bang, POT jumps over 6% and not only breaks through the $95 mark but goes on to break the $100 mark and close at just under $101. The volume that day? 15.7 million, over 50% above the average daily volume. So even if you missed the initial breakout on 12th May given the bullish nature of the volume that accompanied it you could still have joined the POT party the next day. So what’s happened since Tuesday last week:
- Well Wednesday the stock closed up marginally at $102 with another 15 million shares traded.
- Thursday it moved up to $108 with over 12 million shares traded.
Friday it held its own, closing at $107 and almost 13 million shares traded. - Monday just gone by the stock moved on to $111.50 although volume was not as strong at under 7 million
- And last night it closed at $114.50 with almost 11m shares traded
So while volume is dropping back again I hope you can see the significance of the the big breakout on May 12th on huge volume and the follow through over the following week’s trading. Even if you only went long last Wednesday after the initial breakout on Tuesday you would still be looking at an over 1200 point rise since then, at €1 a tick that’s a pretty nice trade.
The second chart is Crocs (CROX), you know the makers of those rather uncool shoes that you see around the place, the ones with the holes in them. Apologies to anyone who has a pair and thinks they’re the business…but we call it as we see it here on this site. Although I have heard they are supposed to be very comfortable…
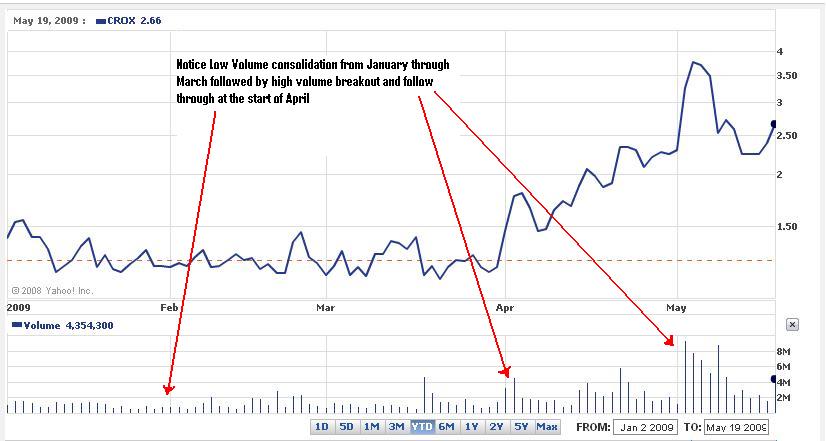
I’m not going to go into as much analysis on this one but you’ll get the picture, similar to POT, this time I’ve included the Year-to-Date chart, you’ll see from the start of January to the end of March the stock was not up to much, chugging along between the $1.15 and $1.40 mark on low volume of around a million shares a day give or take a few 100K – basically a pretty boring stock and not a lot of trading opportunity in it. Then we get into April and it breaks out to the upside, it breaks through $2 a share, $2.50 a share and ends up going over $3.50 a share before pulling back a bit recently. Notice the volume over the last 6 weeks since this breakout began?? 3, 4, 5 million shares a day, even as high as 9 million shares a day for a few days at the start of this month. Clearly money is moving back into Crocs again for some reason, possibly on the back of improved market sentiment, stronger retail figures coming out or just more people starting to think Crocs are cool!
How Volume Adds Weight To A Trend
So to summarise what you should be looking for when it comes to volume, generally it should follow the trend. So if a stock is rising, this upwards trend should be supported by large volume, backing up the thesis that more and more money is moving into the stock. An interesting thing to note here is that as a stock’s price rises and it naturally becomes more expensive to buy, increased volume means even more physical money is moving into that stock. For example, in the CROX example above, early in the year approx $1m a day was been spent by investors buying Crocs shares (around 1 million shares a day at a little over a dollar a share), more recently however we have seen upwards of $15m getting spent buying up CROX stock on a daily basis (over 5m shares a day at approx $3 a share). It’s a clear sign that the demand for the stock is increasing and that more and more money is been invested in it.
The reverse is also true, if a stock starts trending downwards, for it to signal a significant sell-off again you should be looking for large volumes to back-up the downward trend, that’s the sign that tells you people are dumping this stock as fast as they can and are ready to accept whatever price they can get for it on the open market. If on the other hand you see the stock fall sharply but on much lower volume than normal, chances are it is not a significant sell-off but perhaps instead just one particular shareholder who needs to sell his holding to get his cash out quickly for whatever reason. If such a low volume breakout to the downside is not followed up with either more sustained selling or some bad company news, results or whatever then you should consider it as a false breakout and be looking for the stock to move back into it’s previous trading range.
Volume as an Indicator of Overall Market Sentiment
Looking at the part played by trading volumes from an overall market perspective the same ideas hold through. If we are in a Bull market stocks indices will continue to make new highs on larger volume. If this volume drives them up too far too quickly they may fall back as new buyers are less eager to jump in and some profit taking from those who got in early kicks in. However if these pullbacks are on lower volume that’s a bullish sign, it means there’s no big sell-off going on. If these slight pullbacks end up getting bought into (by those who missed out the last time) and result in the market getting driven on to new highs, again on large volume, that’s what gives us our overall bull market and from a charting perspective will give you the higher highs and higher lows that we look for.
In a Bear market, such as the one we are in the middle of right now, we see the reverse. Investors sell off very quickly, driving the price lower on large volume. Sometimes the sell-off will be so quick and so severe that a lot of shareholders will miss it or will decide that they are not happy to sell at the current price because it’s too low. This can lead to low volume pullbacks but in a real bear market these will be met with renewed selling once the price rises to any reasonable level, ultimately pushing it to new lows. The process continues giving us lower lows and lower highs each time.
Final Thoughts On Volume, For Now…
So to finish up, volume is something that is often overlooked by traders, they look at the chart and make their decision off price alone. I think one of the reasons this is that a lot of the trading platforms out there don’t include volume as an option in their charting software. If that is the case with whoever you are currently trading with it is still no excuse for not taking 2 minutes to log onto Yahoo Finance or whatever and having a look at the recent volume and how it compares with the average volume over the previous few weeks or months. I have no doubt I’ll touch on this topic again in the future as there are plenty of other technical setups where volume can play a part but for now hopefully the examples covered above will give you some guidelines on what you should be looking for before you pull the trigger to Buy, Buy, Buy or Sell, Sell, Sell!
