


Analyzing Stocks
You’ve arrived at one of the more challenging, but fun aspects of investing in stocks – trying to find the right ones to buy. As you proceed through your final lesson, we’re going to give you the tools and knowledge to make you an informed investor.
In this section, you will…
- Learn what makes for great value in the stock market
- Learn how to compare stocks to find the best buys
- Practice analyzing stocks using price-earnings ratios
As we reviewed earlier, if you are just starting out investing on your own, or are somewhat conservative, value investing is the way to go.
Even if you can’t resist the lure of high-growth stocks, it makes sense to have a good deal of your portfolio in value stocks. Value stocks can help you build long-term wealth and offset the worries that come with investing in high-flyers that always carry the danger of dropping back to earth.
Buying stocks on a value basis means you’re already getting them on sale, so they have less room to fall, plain and simple. So let’s get started by uncovering some of the secrets to obtaining deals in the stock market.
Value stocks can help you build long-term wealth and offset the worries that come with investing in high-flyers that carry the danger of dropping back to earth. Buying stocks on a value basis means you’re already getting them on sale, so they have less room to fall.
The Secret to Uncovering Deals in the Stock Market
The most obvious way to make money on the stock market is simple – buy low and sell high.
But how would you do that? Suppose you could choose between buying some shares in IBM at $100 or Wal-Mart at 50$. Which is the better buy?
If you think – or just feel – that we haven’t given you enough information to make your decision, you’re right. The correct answer is “I don’t know which stock is a better buy – or even if either is a good deal – because the stock price in and of itself is meaningless”.
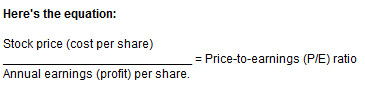
In order to buy stocks cheap, you need to assess what kind of value their price tag represents. To do that, you need to understand what price-to-earnings (P/E) ratios are and how to effectively use them.
“Bulls make money. Bears make money. Pigs get slaughtered” Anonymous
How to Profit From Price-to-Earnings (P/E) Ratios
If you are trying to compare two stocks, one priced at $100 and one at $50, what’s missing is something that puts the two stock prices in perspective to one another.
That something is how much profit the companies earn relative to each of their common shares. (A company’s profits are simply what it has left from its sales or revenues after paying all its expenses.)
The most fundamental way to evaluate one or more stocks is to compare their price to the company’s earnings per share (EPS). This is simply the net profit divided by the number of common shares outstanding.
In addition to the P/E ratio, try looking at a stock’s PEG ratio – its P/E compared to growth rate. The PEG is becoming an increasingly popular tool for assessing a stock’s value.
 How to Profit From Price-to-Earnings (P/E) Ratios
Say a company made $100 million in profit, and had 20 million shares outstanding. It would have made a profit of $5 per share.
If its stock was trading at $50, its P/E would be $50 divided by $5, or 10.
If the stock price was $75, the P/E would be $75 divided $5, or 15. Similarly, if the stock were only trading at $35, the P/E would be $35 divided by $5, or just 7.
The good news is that you don’t have to do all this number crunching – we take care of that for you.
The Easy Way to Understand Price/Earnings Multiples
One way to understand price-to-earnings ratios is this: a P/E ratio shows you what investors are willing to pay for each dollar of profit per share. A P/E ratio of 10, for example, means investors will ante up $10 in order to share in $1 of annual profits.
Obviously profits are key to assessing whether a stock is a good investment. So let’s take a closer look at just what profits or earnings are.
A P/E ratio shows you what investors are willing to pay for each dollar of profit per share.
How Are Earnings Calculated?
The basic equation for calculating earnings is straightforward and we reviewed it in detail in our last Lesson – How To Eyeball Income Statements.
The company totals up its revenues and then deducts the money it had to spend to earn that revenue. This includes things like materials, salaries, advertising and so on. It also has to deduct the cost of any borrowed money, or interest expenses. Finally, just like you, companies have to pay income taxes, and that further eats into their revenues.
After these three major types of expenses are deducted, what’s left over is the company’s net income, otherwise referred to as profits or earnings.
“The only thing money gives you is freedom of not worrying about money” – Johnny Carson
Just Why are Earnings So Important?
Open the business section of your newspaper and you’ll commonly come across headlines such as “earnings are ahead of projections” or “earnings warning released”. Depending on the news, investors can be delighted or concerned as a result.
Just why do earnings get so much attention anyway? As we’ve seen, earnings is just another word for net profits – how much money a company ends up with from its sales, after paying all its expenses.
And in the capitalist world, there’s nothing more important than making profits. The more profits the better. But what really matters to investors is how much money the company makes per share. In fact, when you hear news stories about a company meeting or failing to meet its earnings expectations, they typically aren’t talking about the company’s overall profits, but earnings per share.
The Importance of Earnings Per Share (EPS)
What usually is being referred to in the business news is a company’s earnings per share – how much profit it made for each outstanding share.
But investors aren’t just happy with good earnings per share. What they want and usually demand, is that companies make more money per each share as time goes on.
To translate that into financial jargon, what makes for a good stock is a company that increases – or grows – its earnings per share every year, or even every three months (referred to a quarter in business jargon since three months equals one quarter of the year).
Let’s take a moment and look at why a growing EPS is so critical for investors.
“It requires a great deal of boldness and a great deal of caution to make a fortune, and when you have it, it requires ten times as much skill to keep it” – Ralph Waldo Emerson
How Profits Affect Stock Prices… Explained In Plain English
Investors like to see companies not only make a profit but increase those profits. If a company makes $3 per share this year, investors would like to see it earn an extra $.30, or a total of $3.30 the next year.
Why? Suppose that investors are willing to pay no more and no less than $10 for each dollar of earnings. In other words the stock continues to trade at a price where its P/E ratio remains at a steady multiple of 10.
This year, the stock would trade at $30 ($30 price per share divided by $3 in earnings per share = P/E of 10). Next year, if earnings increase by $0.30, or 10 percent, the stock price will also have to appreciate by 10 percent to keep the P/E ratio constant. In other words, the stock price would have to rise to $33. ($33 price per share divided by $3.30 earnings per share = a P/E of 10)
How do companies increase their profits? One of two ways: The first is they can sell more of their goods and services. The second method is that they keep their sales at the same level, but find ways to become more efficient; thereby cutting the costs of doing business, and leaving more profit left over after all the bills are paid.
“Many people take no care of their money till they come nearly to the end of it, and others do just the same with their time” – Johann Wolfgang Von Goethe
Why P/E Ratios are All Over The Map
Different companies trade at wildly different P/E ratios. The reason is that earnings aren’t static. If a company made the same earnings per share year in and year out, its P/E ratio would likely level out. And if that happened, then the stock wouldn’t budge. That’s kind of the case with utility companies as we explained in Module Three, Lesson 6.
On the other hand, consider a company that has a track record of boosting its earnings in a big way, year after year. The company’s stock will generally trade at a much higher multiple or P/E. Investors are willing to bet that, after considering the company’s management, the industry, competition, and the prospects for the economy, the company will continue to increase its earnings per share at an above-average rate.
So much for faster and slower growing companies. But what makes a particular company “cheap”?
How To Buy Stocks “On Sale”
The best method to begin investing in stocks is to look for value. In other words, buy stocks that are cheap in terms of trading at a low price-to-earnings multiple.
Cheap, of course, is a relative term. Something is only cheap compared to something else. And in the stock world, if you want to find cheap stocks, there are a few comparisons you need to make, namely:
– A stock’s current P/E compared to its historical P/E
– A stock’s P/E compared to its competitors
– A stock’s P/E compared to the overall stock market
“If you can’t make money on $1, if you coax $1 to work hard for you, you won’t know how to make money out of $100,000.” – E.S. Kinnear
Compare a Stock’s Current P/E to its Past P/E
In order to determine whether a stock is cheap or not, the first step is to compare its P/E to its historical P/E. Sometimes, for instance, a company runs into some bad news. Perhaps, like Microsoft recently, the bad news comes in the form of a legal threat to the company’s ongoing growth. Sometimes it’s a new competitor.
For example, take the company called THE BIG PHARMACEUTICAL MAKER that typically trades at a P/E of 26. The company runs into a delay in getting a new and lucrative drug approved. Investors turn tail on the stock, and its P/E drops to just 18.
There’s a good chance that if the company overcomes the regulatory hurdles, investors will reward it by revaluing its shares so it can once again pay its historical P/E of 26. So if you bought the stock when it went “on sale” you could make a handsome return.
Relative P/Es: Looking At How Related Companies Are Priced
Just because a company’s P/E is lower than its norm doesn’t make it a good buy. You should also take a look at the average P/E for other companies in the industry, and examine whether it is static, or trending up or down. For instance, say the pharmaceutical industry trades at a P/E of around 20. How could you use that information?
If THE BIG PHARMACEUTICAL MAKER had a P/E of 17, it might mean it was undervalued compared to its peers. The flip side, though, is that the market as a whole may have realized something is wrong with the company – say its patent on a big revenue-earnings drug is coming to an end – and that it won’t grow as fast as others in the industry. In that case, it may still be overpriced, even though its P/E is less than the industry average.
“Money is the sixth sense that makes it possible to enjoy the other five” – Richard Ney
The Market’s Average P/E: A Useful Benchmark
When assessing any individual company, it’s wise to also compare it to the market’s overall price-to-earnings ratio. This overall average P/E for the stock market can also ebb and shift over time. A big example of that came in the late nineties. In 1995 the average P/E of the S&P 500 index was 15. Within four years, that had doubled to 30.
Just as businesses, and indeed industries go through up and down cycles, and investors fall in and out of love with them, so too does the market as a whole.
In 1995 the average P/E of the S&P 500 index was 15. Within four years, that had doubled to 30. The more money people and companies have to spend, the more other companies can sell, and the fatter their earnings get.
In the late nineties two important factors came together to boost average P/Es. First, the economy was firing on all cylinders. Economic growth is important for investors. The more money people and companies have to spend, the more other companies can sell, and the fatter their earnings get. At the same time interest rates were falling steadily. This served to make stocks increasingly attractive even as their P/Es rose.
The impact was to make stocks relatively more attractive compared to interest-earning investments. Falling interest rates also made it cheaper for companies to do business, further fueling the economic machine. And finally low interest rates made it cheap for consumers to borrow for purchases, adding another log to the economic fire that was blazing away.
The Myth of Easy Money
Nothing…that’s why it was too good to be true. And like the saying goes, if something seems to good to be true, that’s most likely the case.
If you want to make money over the long haul, the stock market is a great place to invest. However, you have to be more careful when mania grips a sector – or the stock market as a whole.
Human emotions and behavior are an integral part of stock prices. And every now and then, excessive enthusiasm seems to grip investors. You may have heard the phrase “irrational exuberance”. This was how Alan Greenspan, the Chairman of the Federal Reserve described the market mania that had investors bidding stock prices up to record levels.
Hard Lessons From Amazon.com: Why Potential Can’t Take the Place of Profits
Consider the love affair investors had with the on-line book (and eventually almost everything else) selling company, AMAZON.COM.
Despite not having yet turned a profit, in early 1999 Amazon was being valued by the stock market at more than 12 times the value of Barnes and Noble. This despite the fact that, unlike Amazon, the well-established bookseller had three things going in its favor:
- It had a long and proven track record
- It was making a profit
- It was selling a lot more books than Amazon. In 1998 for instance, Barnes and Noble had sales of almost $3 billion. Amazon? A relatively puny $400 million!
Key Learning Points
- A price-to-earnings (P/E) ratio or multiple is one of the most important things to know about a stock.
- A stock’s P/E is simply the stock price divided by how much profit or earnings the company made per share.
- The P/E tells you what investors are willing to pay for $1 of profit. A P/E of 10 means investors are willing to pay $10 for every $1 of profit the stock generates.
