


How to Inspect Income Statements
In this section, you’ll learn…
- Learn what an income statement can tell you
- Learn what makes for stock-friendly earnings and red flags
- Learn how to examine expenses to determine how a company is faring
“Spend as much time researching a stock as you would buying a refrigerator” – Peter Lynch
“Whatever you have, spend less” – Samuel Johnson
Why You Should Be Interested In Income Statements
Given the importance of earnings (also known as net profits), one of the key documents for assessing a company is its income statement.
An income statement is nothing more than a company’s equivalent of your checking account statements. The income statement identifies the company’s major sources of revenue and expenses, as well as income taxes, and it sums things up on the line labeled net earnings or net income.
While it’s a long and admittedly clumsy title, income statements are really a “how much stuff we sold and what it cost us to make and sell that stuff ” statement.
The single most important bit of information one should glean from the income statement is the quality of a firm’s earnings. It’s not just whether profits are rising or falling; it’s how they’re rising or falling.
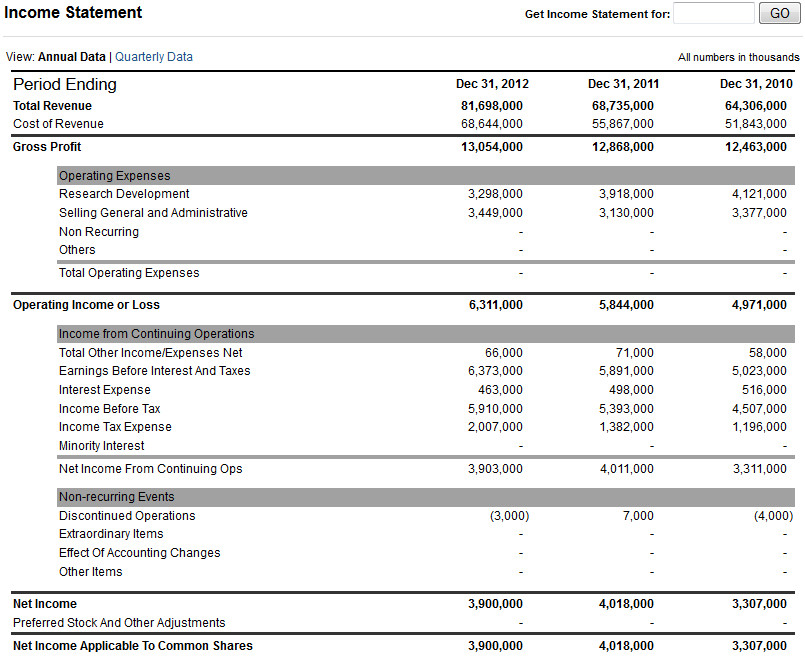
Let’s take a look at Boeing’s income statement, using the same approach used to obtain Boeing’s balance sheet.
Income statements are really a “how much stuff we sold and what it cost us to make and sell that stuff” statement. Investors like companies that have a history of steadily increasing revenues or sales.
Let’s take a look at Boeing’s income statement, using the same approach used to obtain Boeing’s balance sheet.
How To Approach Income Statements
Like a balance sheet, income statements are usually displayed on-line as a long document with one section following the next. Income statements also typically deal in millions of dollars.
There are the main sections to an income statement – revenues and gross profit, operating expenses, operating income and net income, and finally earnings-per-share. Let’s review each of these in more detail.
Revenues: Just as your paychecks are deposited to your bank account, a company receives and records what it makes from selling its goods and services. This money that flows into the company over the year is called its gross revenues, also referred to as sales.
Cost of Goods: This is the sum of what the company paid out for the raw materials it had to buy to make its products. It also includes the cost of producing those goods.
Gross Profits: This is an important line for investors. It’s what the company has left over from its sales after paying for producing its products.
“90% of the people in the stock market, professional and amateurs alike simply haven’t done enough homework.” William J. O’Neil
Selling/Administration/Depreciation/Amortization Expenses: Companies can’t just make their goods and hope to have customers show up at the door. They have to hire salespeople to sell them and staff to run the office, sign the checks, and plug in the computers. Another cost of doing business is when equipment wears down, and is worth less year after year. This is an expense of doing business, and is called depreciation.
Non-Operating Income: This is extra money the company brings in outside of its normal line of business.
Interest Expense: If a company borrows money to run its operations, the cost of using that money is an expense of doing business.
Pretax Income: This is what a company earns before having to pay taxes on its profits
Income Taxes: No surprise here. This is what the company has to hand over in taxes on its profits.
Net Income: The ‘big kahuna’ of the income sheet. This is how much a company ends up with from its sales after all operating costs and general expenses are accounted for.
The net income line is very important because the company’s net income is divided by the number of shares outstanding to arrive at how much money the company made in profits per share. This is also known as the earnings per share, or EPS. It’s this number that is on the bottom of the price-earnings equation – how much a stock is currently trading for divided by how much money the company made per share. The result of this bit of division, the P/E ratio or stock multiple, is one of the single most important numbers needed to evaluate a stock.
“With enough inside information and a million dollars, you can go broke in a year” – Warren Buffett
Mining An Income Statement For Red Flags
Investors like companies that have a history of steadily increasing revenues or sales. Overall, this is an indication that the company continues to find favor with its customers, and is able to sell more of its goods and services.
But revenues can often provide some useful warning signs for problems afoot.
Looking Out For Red Flags
There are some telltale signs that a company may be having some problems. One such sign would be that revenues are growing, but at a slower rate each year. Even worse is revenues that are shrinking. In either case, you should be asking the question “why?”
In some cases, it may mean the company’s future does not look particularly bright. This could be because its products are falling out of favor, its services are becoming less in demand, new and better offerings are coming onto the market from other companies, or new competitors are offering the same products and services at a lower price.
One sign that a company may be having some problems is that revenues are growing but at a slower rate each year.
Keep an Eye On Recent Acquisitions
Another red flag may be that a significant portion of revenues comes from a recently acquired division or company. Sometimes companies acquire other businesses in an effort to kick-start their own stuck-in-the-mud sales. However, they sometimes aren’t able to maintain the sales of the new acquisition’s products, because they don’t understand the fundamentals to that particular business.
“When I talk to a company that tells me the last analyst showed up 3 years ago, I can hardly contain my enthusiasm” – Peter Lynch
Keep An Eye Out for Outlets
You should also do a little detective work if the company you’re examining is involved in a business where it brings in revenues from many different locations – for example a restaurant chain or national retail chain. In some cases, it may look as if the company’s revenues are rising at an attractive clip. But this may be a result of it rapidly opening new outlets. In actual fact, consumer interest in the company’s products may be falling off.
How can you determine this? Separate out how much of a company’s changing revenue picture is the result of new outlets, versus increasing sales at existing outlets. In the financial world, this is sometimes expressed as “same stores” revenues.
How to Eyeball a Company’s Expenses
When your paycheck hits your bank account, your cash situation looks temporarily good. But a few days later, things don’t look quite so wonderful after you’ve paid your mortgage (or rent), bought some groceries, and put gas in the car.
To consider yourself as a simple money-earning machine, you have to make some purchases – food to fuel yourself, gas to get to work, clothes so they let you into the building, and so on. These expenses enable you to sell your services – namely your time and energy to a customer – namely your employer.
In much the same fashion, businesses have to incur a number of expenses in order to ring up sales. When a company keeps a lid on expenses, it means more of its sales end up as net profit. But when expenses grow too quickly, they can entangle a company in tons of trouble.
So what defines ‘under control’ or ‘too quickly’? Let’s take a look at some useful benchmarks.
In Line or Out of Control – How To Evaluate Expenses
One broad test for measuring how well a company manages its expenses is to compare how quickly a company’s expenses are growing compared to the growth rate of its sales.
Most companies will do this for you somewhere in their annual report. You’ll often find a chart that gives you the company’s expenses as a percentage of revenues, and how that changes.
What investors like to see in general is expenses falling as a percentage of revenues. Say for example a company sold $100 million worth of products the year before last, and it cost them a total of $80 million in expenses to earn those sales. In this case expenses were 80 percent of sales (80million/$100 million).
Suppose the next year they managed to boost sales to $120 million, or an additional 20 percent. In this case, most companies’ expenses will increase as well, but only marginally. After all, they might have to buy more raw materials to turn out more widgets, pay extra salespeople, and buy some new computers to handle the extra customers.
What investors like to see in general is expenses falling as a percentage of revenues. However, don’t always assume that rising expenses are a bad thing.
Doing More With Less
An efficient company, though, can do more with less. In other words they can boost sales faster than they increase expenses. So in our example above, expenses might have only increased to $88 million, or at a rate of 10 percent, in order to boost sales by 20 percent. Now that’s efficiency. So the ratio of expenses to revenues dropped from 80 percent ($80million/$100 million) to 73 percent ($88 million/$120 million).
“I like to live as a poor man with lots of money” Pablo Picasso
Extra Sales At What Price?
In many cases, companies spend too much money to bring in extra revenue. Inefficient companies typically pay dearly for extra sales – hiring too many sales people, buying raw materials at a premium, pouring millions into a massive ad campaign, and so on.
The Problem With Buying Sales
While this makes the revenues look good, it may actually make the company less profitable. Suppose a company increased its expenses an additional $20 million ($80 million to $100 million) in order to earn an additional $20 million in revenues ($100 million to $120 million). That means its expenses increase at a faster rate – 25 percent – than its revenues, which grew at just 20 percent.
The result is that when you compare the percentage of expenses to revenues, the percentage actually grew from 80 percent ($80 million/$100 million) to 83 percent ($100 million/$120 million).
So remember this simple statement – the faster revenues increase compared to expenses, the more profitable a company will become.
Having said all this, you still need to be careful. Some expenses are better than others.
Good Expenses, Bad Expenses
Don’t always assume that rising expenses are a bad thing. For instance, you might start working part-time in order to obtain an extra degree. Your income will drop, and your expenses will certainly soar. However five years out your personal financial picture may be a lot brighter. That extra degree may have helped win you a much higher-paying position.
Similarly with companies, more dollars spent today may help ensure continued growth and long-term profitability. A manufacturing company for instance, may have realized its product line is quickly becoming outdated and decided to invest a load of cash into research.
The extra money spent today on developing a new line of offerings will make its financial situation look less attractive in the short term. However, that expenditure may be the start of a whole new successful stage in the company’s evolution. Similarly, many high-tech, pharmaceutical and biotechnology companies have to regularly invest large sums of money today in order to ensure they develop products that will be in demand in the future.
Key Learning Points
- An income statement is similar to your checking account statements. For a specified period, it shows how much money a company brought in, and from where. It also shows the money that went out of the company in terms of expenses in order to earn those sales.
- Net income refers to how much money a company is left with after paying its expenses. It is one of the most important things to know about a company. Net income is divided into the number of shares outstanding to arrive at how much money a company makes per share. This is called its earnings-per-share, or EPS. This number in turn is used to calculate its price-earnings ratio. This number, also called the P/E ratio, is simply the stock price divided by the EPS.
- All else being equal, investors like companies that do two things. First, is increasing revenues each year. Second, is keeping more of each dollar being brought in. A company can do this by either charging more for its products, or reducing expenses.
- Rapidly rising expenses aren’t always a bad thing. For example, money spent wisely on research & development today may result in a company producing a world-leading product in the future.
