


Candle Patterns
Let’s take a quick look at some of the more important 2 candle patterns that you will often look for when charting. All of these have specific names, however I created a single rule that covers all of these patterns. That way I don’t have to memorize them all and risk missing one. It is called the 50% rule and it works like this: A stock is moving in a certain direction, there could be 2 or 3 days of trading in that direction when all of a sudden, the momentum shifts and an opposing candle shows up. If that opposing candle breaks 50% of the previous candle, then it is a potential swing, and it fits in one of these categories. Read through these examples and it will make sense.
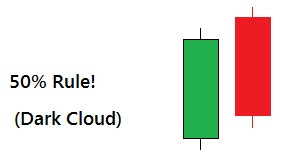 Dark cloud: A stock is moving up, has a good day, creates a solid candle, and then the trading day is over. The next day we see a red candle. This candle closes 50% below the previous day’s candle. Might be a swing. For further explanation look at the 50% line drawn below:
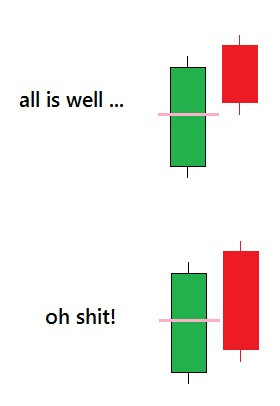 Why is this important? Well smarty pants… what is more important that finding a great stock to buy? Knowing when to sell! New traders often make great buys, but they don’t have a plan when it comes to selling. I would argue that finding great stocks to buy is really only 30% of the game. A good trader can sell it at close to the top and make 3X more than the new guy. So the 50% rule helps to tell us whether we are just seeing a pullback vs. the actual end of the upward run.
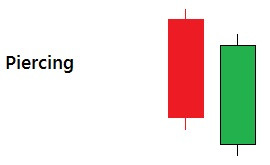 Piercing. Same concept but reverse. We see a down day followed by an up day. The up day closes above the 50% line of the previous day’s candle.
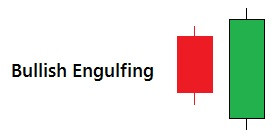 A bullish engulfing pattern appears when the 2nd day of trading opens below the previous day’s close and then closes above the previous days open. In this example, the 2nd candle is actually ‘gapping’ down before it trades upward. This signifies a very strong opposition to the previous day’s trading.
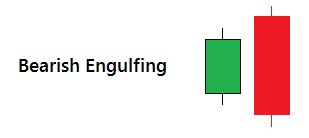 A bearish engulfing pattern appears when the 2nd day of trading opens above the previous day’s close and then closes below the previous days open. The 2nd candle is actually ‘gapping’ up before it trades downward. This signifies a strong opposition to the previous days positive candle and a swing may be in order.
 Morning star: a positive candle, followed by a shooting star, and then a negative candle. In this example we see that the shooting star is ‘floating’ above both candles. This is due to a gap upward and then a gap downward. Very strong indication of a swing. Often times I will see ‘morning star’s but with no gap. Think of the morning star as the ‘peak’ of the mountain after a stock’s upward run.
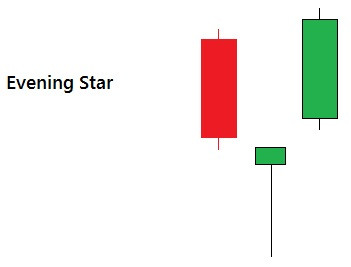 Evening star: A negative candle, followed by a hammer, and then a positive candle. In this example we see that the hammer is ‘sunk’ below both candles. This is due to a gap downward and then a gap upward. Very strong indication of a swing. Often times I will see an ‘evening star’ but with no gaps (or maybe one gap). Think of the evening star as the ‘valley’ of the mountain after a stock’s downward run.
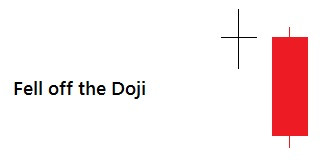 One of my personal favorites. In my videos you will often hear me screaming “I GAVE YOU A CHANCE! BUT YOU COULDN’T HOLD ON! YOU FELL OFF THE DOJI! IM THROUGH WITH YOU! I’LL COME BACK LATER FOR MY CLOTHES, CD’s,…!” But seriously, this damn thing has helped me sell at the absolute top and buy at the absolute bottom many, many times.
It is simple. If you see a doji -and the next candle closes below the doji – then you have a very strong down signal. If it was running upward when this pattern showed up, it might be time to dump it and move on. If you were watching a stock tumble and trying to decide when to buy, you might want to wait.
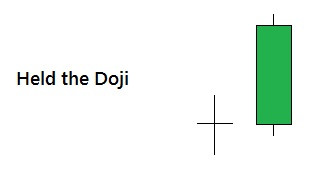 The opposite: If you see a doji, and the next candle holds on and closes above, its a strong upward signal. If this stock is making a run upward and you have already bought in, keep holding until the stock tells you otherwise. If you are watching a stock fall and trying to decide when to buy in, this might be the time to do it.
Often times you will buy a stock, hold on for a few days, and jump for joy as you watch it make a solid run. Then the doji shows up. Time to pay attention. The next day’s trades will give you a very strong indication of what is going to happen. Unfortunately, I often see a stock dump everything it gained in 1 single candle after that damn doji showed up. In my video, I show you a very important tip on how to avoid this to ensure you keep all that profit.
So that wraps it up for japanese candlesticks and candlestick patterns. I hope you learned a few things and did’t cry too much along the way.
If you have made it this far, then it is time to look at some actual charts and learn the all important technical analysis indicators.
