


Japanese Candlesticks Charting Techniques
Let’s go over some more candlestick examples, and then discuss a few very important patterns. You will notice these descriptions get a little wordy- this is because we gather a lot of info from a single candle! If you are having difficulty understanding the written descriptions, then go check out the videos. There is a great video dedicated to these candles and it is MUCH easier to understand as I walk through each example.
 So these are pretty straight forward. Stock opened, didn’t do much, and then closed either up (green) or down (red). We see that there were no extreme highs or lows (wicks) for the day.
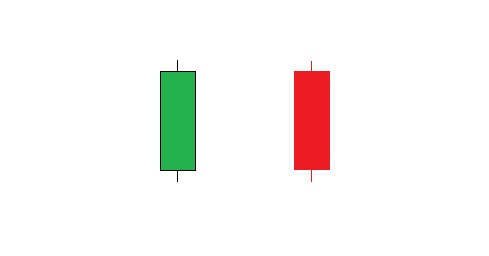 Green candle: Stock opened and took a small dip, but then climbed for most of the day. We see that the bulls were in control for most of the day. It came down and closed near the high. Red Candle: Stock opened, climbed a bit at some point, and then tumbled down for most of the day. We see that the bears were in control. It closed near the low.
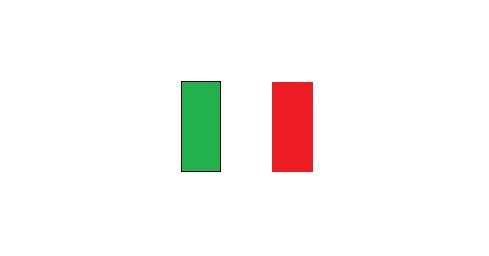 These candles are very similar to the previous ones, but without the wicks. Why is this significant? This tells us that the stock was consistently moving in one direction without any indecision. Green candle: After the stock opened, it never fell below the opening price. The opening price was the lowest trading price for that day. It traded positively even up until the last trade. The closing price was the highest price. Bulls in full control. Red Candle: Bears in full control. It never traded above the opening price. It traded negatively even up until the last trade. The closing price was the lowest price. Both of these show decisive direction.
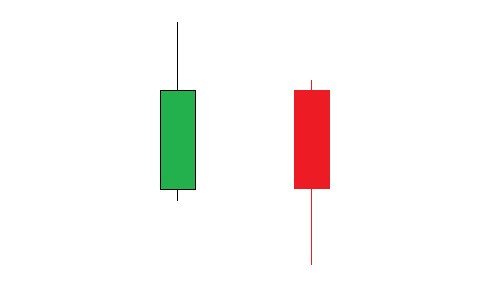 Green candle: Stock opened and at some point fell down a bit. However, it jumped really high but then fell sharply, while still closing positively. Red Candle: Stock opened and gained just a bit. It then fell sharply, but also made a very strong comeback before closing. Yet it still closed at a loss overall.
Those are just a few more examples of the type of information we can gather from candlesticks. I think you get the point. Now lets get into the important candles that you should have hanging on your wall (or in your head). These are all indicators of a potential swing.
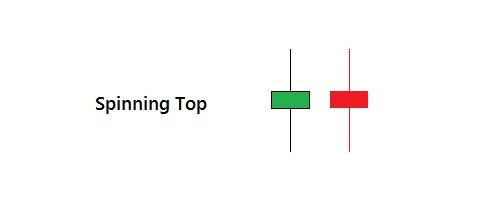 The Spinning Top has a thin body with long wicks. Both represent a potential reversal. This tells us that the stock opened, traded fairly high, fairly low, and then closed relatively close to where it originally started. If you see this in conjunction with other clues, it might represent real indecision and a potential swing. Love me some spinning tops.
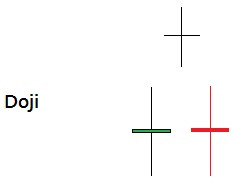
The wonderful, majestic, gorgeous, incredible, amazing, beautiful doji. When we see a doji, we know that the stock opened and closed at the same price (or very very close to the same price). However, during the trading period there was a struggle from high to low. Indecision!
When I first started looking at charts, I would hardly notice dojis. Now, my eyes snap right to them as if they are were all circled with a neon yellow highlighter. Time and time again, you will see a stock fall and fall and fall, and then the doji appears. It never ceases to amaze me.
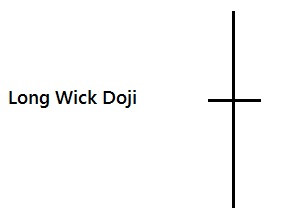
A long wick doji is a doji with much higher and lower extremes. These are rare. I like to think of dojis like this: the longer the wick, the stronger the possibility of a swing.
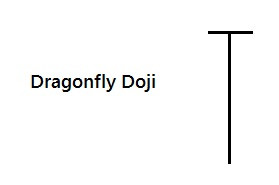 A dragon fly doji appears when the stock opens, falls sharply, but then makes a strong comeback and closes at its original price.
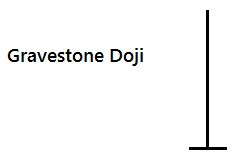 A gravestone doji usually appears after a stock made a strong run upward. The stock opened, traded really high, and then fell sharply to close at its original price.
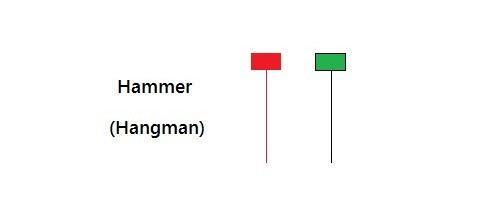 A hammer is similar to a dragonfly with the exception of a short body. I describe the hammer in detail here. The red hammer tells us that the stock opened, fell sharply but then made a strong comeback. However it did not climb back to its original price and closed slightly low.
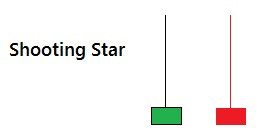
A shooting star is similar to a gravestone doji with the exception of having a short body. The red shooting star tells us that the stock opened, climbed significantly, but then fell sharply and ended up closing even lower than it started.
