


How to Read Stocks
You can have 6 LCD monitors, a beefy trading computer, and the most expensive software in the world… but if you don’t know what to look for, you will never make a dollar. In order to execute a positive trade, you need to understand exactly what is going on behind that seemingly simple chart.
There are plenty of good scanners out there, but those scanners don’t execute my trades. My eyes have the last word and in order to find good trades, I have learned how to read stocks very meticulously and efficiently. When looking through potential stock picks, I am trying to find the good charts, my entry points, and my multiple exit plans. Oh, and I am trying to do it in a timely manner because, let’s face it, I would rather be playing golf.
I do this with Technical Analysis. As we discussed before, Technical Analysis is different from Fundamental Analysis. Fundamental analysis involves studying the company, their industry, their finances, and much more. Often times, this is called Trading the News. Of course any strategic knowledge about what is happening within the company or it’s industry is a plus. For example, if you are thinking about buying a pharma stock, and they have a new life saving drug under review with the FDA, you may have reason to believe they will get approval. In this case, you buy the stock, the drug gets approved, it makes global headlines, and the stock soars. Pretty easy huh?
Um…no.
 You see, there is one guy who is just slightly more powerful than a person with money… and that is a person with knowledge. Wall Street knows this and if you think you are going to be ahead of the curve when it comes to trading the news, well you are in for a rude awakening.
Don’t get me wrong. Fundamental Analysis is the age old method for trading stocks. But for me, it borders too much on gambling. I prefer more certainty.
So… we aren’t relying on the news for our information, we rely purely on the charts and the phenomena that live within the charts. Phenomena? Yes.
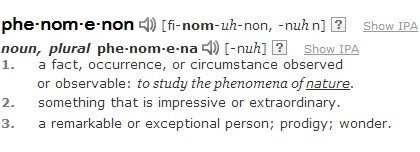 When we compare stock charts we often find similarities across millions of different, seemingly unrelated, charts. These patterns tend to repeat themselves no matter what type of security we are looking at. Many of these patterns appear just before the chart shifts, or ‘swings’, in a major direction. If we identify these patterns and look for them in a live market setting, we can reasonably predict, and capitalize off of, these movements. I would say this qualifies as ‘something that is impressive or extraordinary’ and hence, a phenomenon. A phenomenon that makes thousands of traders, across the globe, very wealthy.
The problem is that most stock charts aren’t in the right format for us to easily recognize or “see” these patterns. There are many different ways to plot a chart but most finance sites (like Google and Yahoo finance use) line graphs. Bleh. Others may use OHLC charts or ‘tick charts’ which is better, but that still doesn’t give us the full picture. Here at STM you will learn how to read stocks using candlestick charts.
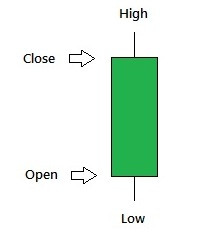 Once you learn how to read stock charts with Japanese Candlesticks, you will never look back. The patterns and indicators become much easier for us to identify. With candlesticks, we can see critical swing indicators that would otherwise be completely invisible to us. Candles are a superior way to view charts. In the next post, we will learn why this is and exactly how to use them.
So whaddya say? Is it time to learn how to read charts using candlesticks?
Learn the Japanese Candlesticks (note: I cover very important candlestick patterns that every trader should know).
