


Ascending and Descending Triangle Patterns
Triangles are often used in technical analysis to identify a breakout. A triangle can be ascending, descending and symmetric. However, for now we will be talking about ascending and descending triangle patterns. Ascending and descending triangles usually use resistance and support levels which we will outline below. An ascending triangle is sometimes called a bullish triangle and a descending triangle is sometimes called a bearish triangle.
Ascending Triangle
An ascending triangle uses a resistance level and a rising trend line. We have outlined this pattern via the pair EUR/JPY.
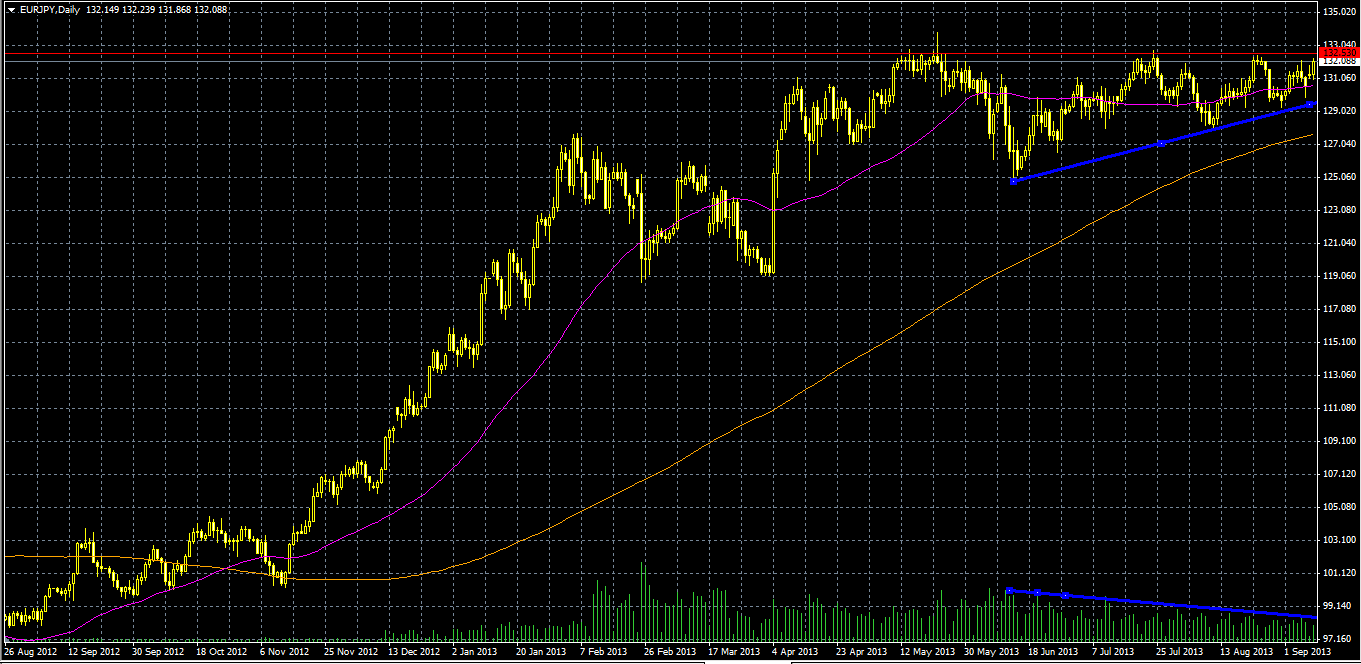
Our resistance level is denoted by the red line and our rising trend line is denoted in blue. So you might be asking how we identify an ascending triangle. Well there a few criteria to look out for. This criterion consists of the following:
- Trend
- Volume
- Projection
It is important to note that an ascending triangle can also be found in a downtrend. So the combination of the name of the triangle and the market trend is deceiving. Thus, the financial asset needs to test the resistance level twice and the assets closing price needs to be higher than the previous closing price. In other words, the closing price has to follow the rising trend line.
Next we come to volume. When in an ascending triangle, volume usually contracts. Although there are a few number of cases that show volume has not contracted but the pattern has been displayed. This has been signified by the blue line at the bottom of the chart (green bars are volume). Ascending triangles are usually displayed on 30 minutes, 1 hour, 4 hours, 1 day and weekly charts.
So you are probably thinking how we calculate the projection. The projection of an ascending triangle is calculated by the following technique.
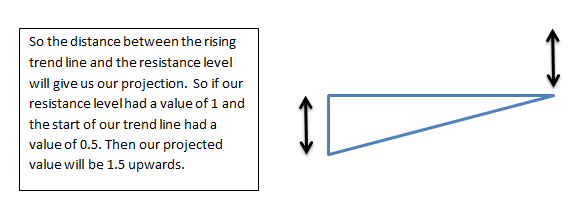
So traders would place a buy order on the far right hand corner of the triangle.
Descending triangle
There is really no difference between the descending triangle and ascending triangle. The only difference is the orientation of the triangle. A descending triangle has two parts which consists of a support level and a declining trend line. The descending trend line is signified by the blue line and the support level is signified by the green line in the picture below. Unfortunately we do not have a live example, however we have tried to exhibit it using the following picture:
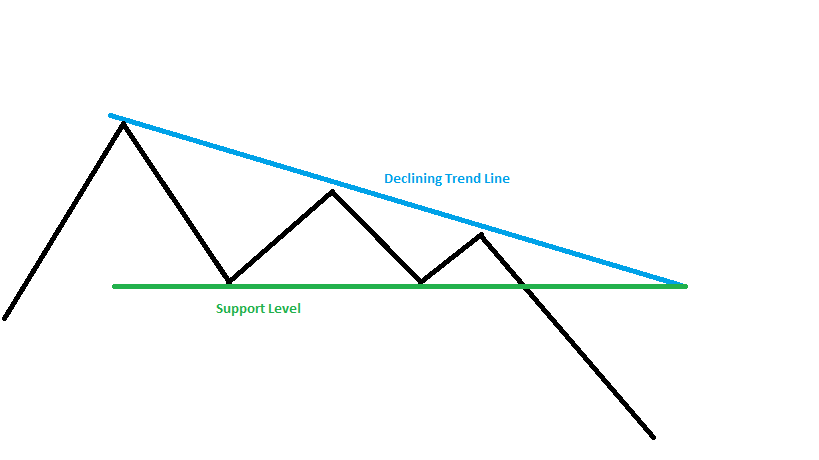
We follow the same criteria as above. A descending triangle usually happens in a bearish market. However, sometimes a descending triangle can happen in an uptrend. Volume also contacts during a descending triangle. It is important to note that volume is a sufficient condition but not a necessary condition for both ascending and descending triangles. In a descending triangle, highs declining in accordance with the declining trend line. A descending trend line can be found on 30 minutes, 1 hour, 4 hours, 1 day and weekly charts. A projection can be found similar to the ascending triangle pattern. It is calculated as follows:
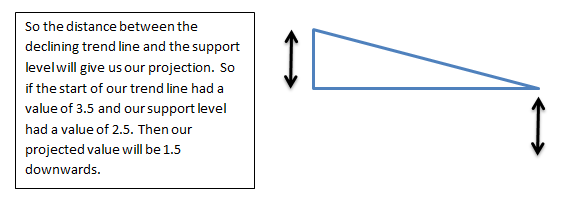
So traders would place a sell order on the far right hand corner of the triangle.
It is important to note that sometimes even when the pattern is displayed, the pattern may not continue. So it is always important to merge your technical analysis and fundamental analysis to get a better view of the market.
CFDs, spreadbetting and FX can result in losses exceeding your initial deposit. They are not suitable for everyone, so please ensure you understand the risks. Seek independent financial advice if necessary.
Nothing in this article should be considered a personal recommendation. It does not account for your personal circumstances or appetite for risk.
