


Creating a CFD Trading Plan
When choosing a CFD trading strategy, new traders can easily become confused or even overwhelmed by all the variables and indicators available for consideration. While trading strategies can be complicated, it is often helpful to have at least one simple “go to” strategy to help you get started. This strategy should be a simple with an approach that you understand, and have the ability to replicate on a day to day basis. Today we are going to review the basics of creating a simple strategy for trending markets, by finding the trend then applying a MACD Oscillator. . Let’s get started!
Find the Trend
The key to any trend trading plan is to first find the market’s direction. If prices are heading higher, the trend is considered up. If prices are generally declining the trend is considered to be down. This is important because traders will only look to sell in a strong downtrend or place new buy orders when the trend is up. While there are many ways to find the trend, traders often employ a MVA (Simple Moving Average) to simplify the process. Let’s look at an example.
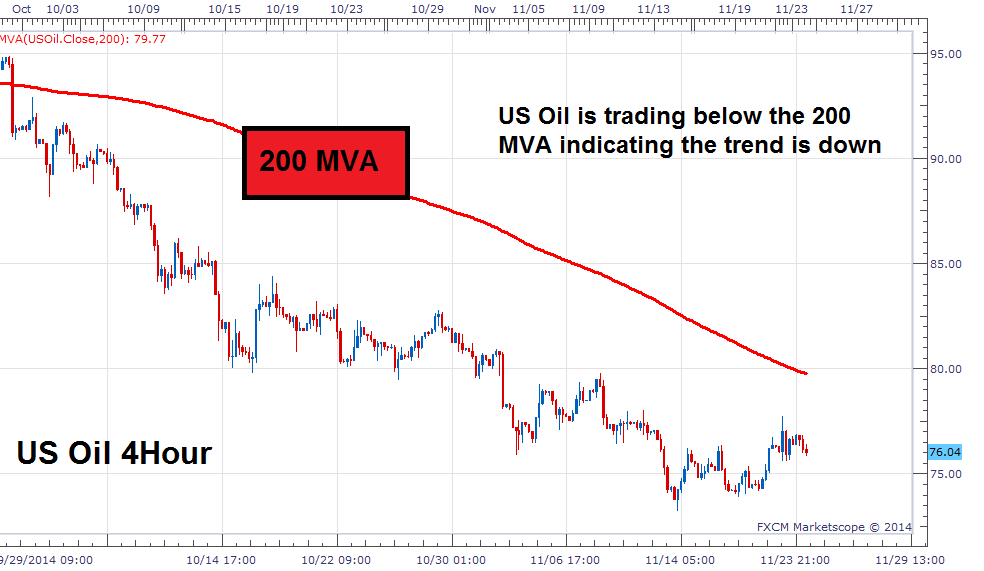
Below we have USOIL (WTI) on a 4Hour Chart. We can see the pair clearly making a series of lower lows and lower highs. This is the first sign that US Oil is trading in a strong downtrend. This analysis can be confirmed using a 200 MVA. Traditionally traders consider the trend to be bullish when price is above the 200 SMA and bearish if price resides under the indicator.
Given the information above, traders should look to sell USOil since price is currently below the 200 period MVA.
USOil 4-Hour MVA Trend
Entries with MACD
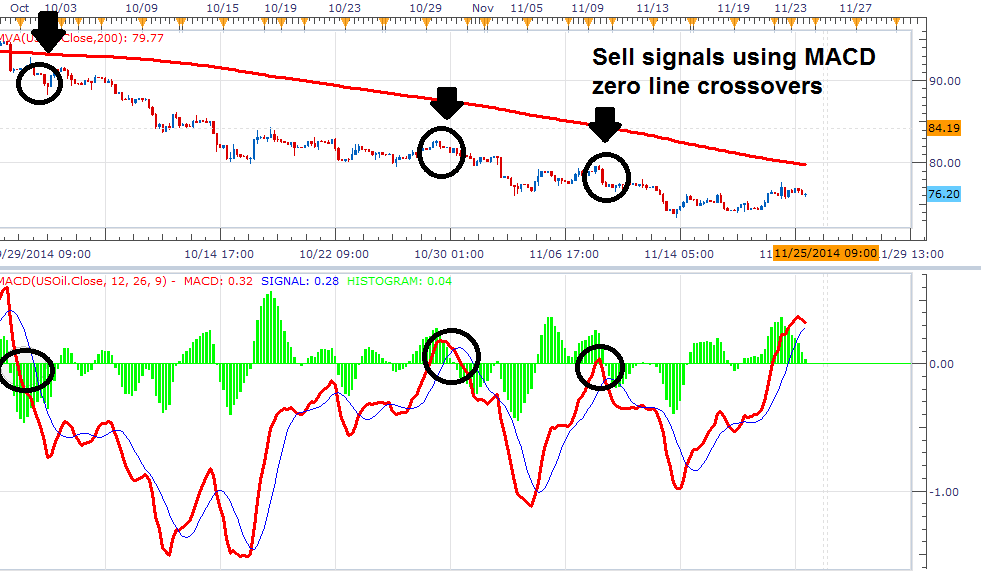
Once market direction is identified, we can then use an indicator to enter into the market. Below we can see the MACD oscillator again on a 4-Hour chart. Since we are only looking to sell in a downtrend, one tactic is to use MACD to sell a retracement. To do this, traders can look for the MACD line to cross above the zero line, then execute their orders when MACD closes back below zero. The idea behind this methodology is to enter the market, when momentum is heading back in the direction of the trend.
Below you will find several sample entries using the MACD indicator. The arrows below price have been included on the chart to better understand where execution may occur. Also notice how MACD is currently reading above the zero line. In the future if MACD again crosses below the zero line, it could signal another opportunity to sell USOIL using this entry methodology.
USOil 4-Hour Chart with MACD
Exiting Positions
Now that a trade has been opened, traders need to have a plan to exit the market. This is extremely important because all trading carries a degree of risk! When trading in a strong trend, like our example today with USOIL, it is important to remember that the trend will eventually come to an end. In a downtrend stop orders can be placed over a previous swing high. Conversely, in an uptrend stop orders may be placed below a current swing low. The idea is, if you are selling a CFD like oil in a downtrend, trades should be exited at the first sign of the trend ending.
Notes:
This is just one of many ways you can approach a simple trading strategy. The key to learning how to place orders while managing risk, in a manner that works for you, is to practice. Feel free to practice this simple CFD trading strategy, or even create your own, using a CFD Demo account. Many brokers offers demo accounts for free. This will allow you to get comfortable with the market as well as well as work on your trading techniques in real time!
