


How to profit from Seasonality Effects in Trading
If you’ve been involved in trading the markets for some time, you’ve most probably heard of sayings like ‘sell in May and go away’, ‘January effect’ or ‘Santa Claus rally’. They all describe seasonal anomalies based on some rough historical observations. Writing this article, I intended to find out if there’s any truth to them and if they can be useful to our trading.
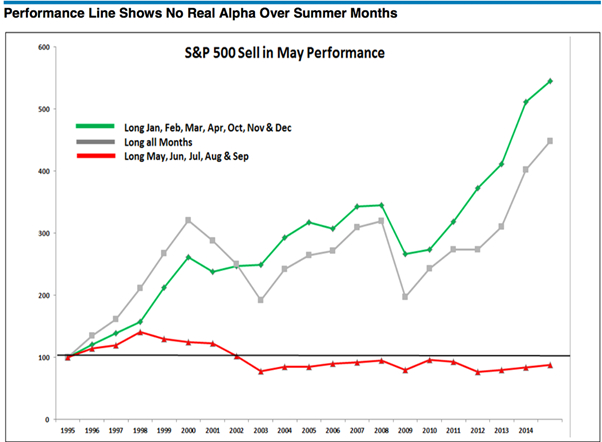
According to global analytics firm Kensho, during the last 20 years, the S&P 500 was positive from the May to October period 65 percent of the time, or 13 of 20 occurrences, for an average return of 1.4 percent. For the November to April period, the S&P 500 was up 85 percent of the time, or 17 of 20 occurrences, for an average return of 7.1 percent. The results are similar for the other two main US indices, Nasdaq and Dow Jones. This clearly shows there is some truth behind the ‘sell in May and go away’ cliche. Having said that, we should always remember that history is best used as a guide and doesn’t give us certainties for the future.
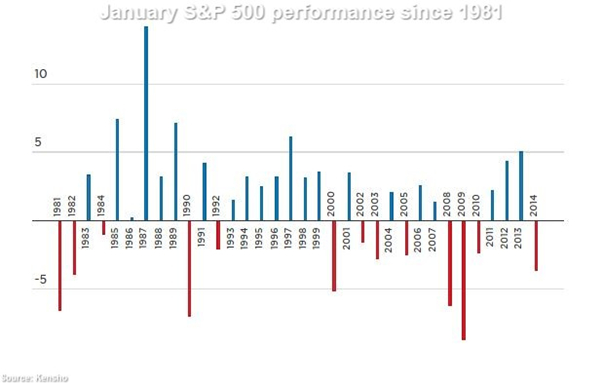
The so-called January Effect describes a hypothesis that stocks go up at the beginning of the year. It was first observed around 1942 by investment banker Sidney B. Wachtel when he noted that since 1925, small stocks had outperformed the broader market in the month of January. But is it still applicable to today’s market ? Not so, if we look at the data going back to 1981. We can see that most of January’s gain’s actually occurred in the bull market of the ’80s and ’90s. Since 2000, it’s almost a coin flip whether the month will be positive or negative.
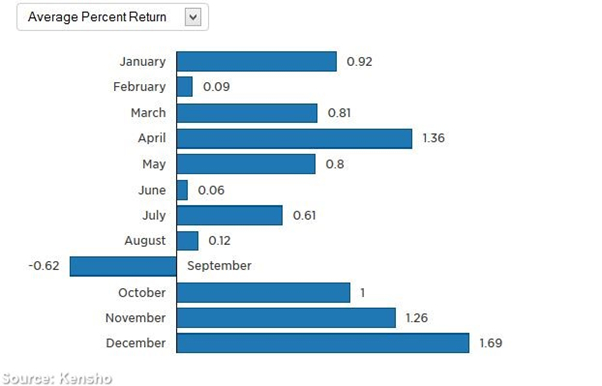
Nevertheless, looking at S&P 500 performance since 1980, we can see that January still has a strong overall performance, but it’s not necessarily the best month.
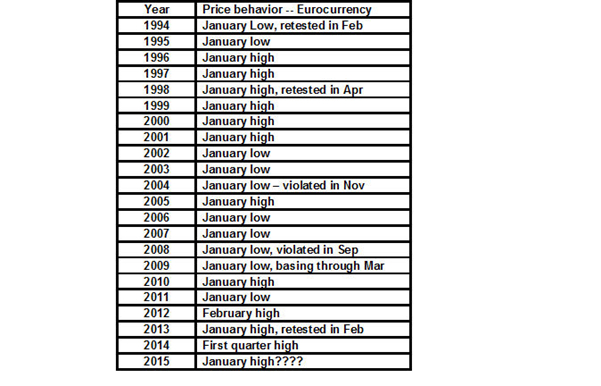
There is also a less known so-called Forex January Effect – in 20 of the past 21 years the Euro has topped or bottomed in January. In four of these 20 years the January high or low was part of topping or bottoming process that was not resolved until February or March.
Simply put, the phenomenon in the stock market commonly referred to as the ‘Santa Claus rally’ is an observation that historically, stocks have tended to rally during the trading days between Christmas and New Year’s. The 22015 Stock Trader’s Almanac shows that since 1969 the Santa Claus rally has resulted in positive returns for the S&P500 in 34 of the past 44 holiday seasons—the last five trading days of the year and the first two trading days after New Year’s. The average cumulative return over these days is 1.6%, and returns are positive in each of the nine days of the rally, on average. Nevertheless, each year there is at least one day of declines. Research over a longer period confirms the persistence of these trends: According to historical data going back to 1896, the Dow Jones Industrial Average has gained an average of 1.7% during this seven-day trading period, rising 77% of the time.
As to the conclusion? The ubiquitous disclaimer in the financial world, ‘past performance is not necessarily indicative of future results’ comes to mind. We should use these seasonal effects as just a point in our trading analysis and not rely entirely that what has happened before will repeat itself identically in the future.
