


The Trend Is Your Friend (Trend lines, Support and Resistances)
A market is a series of waves. A wave is constructed of peaks and troughs and these are what define the direction of the market which is also known as the trend. A trend of a market can be applied to any financial asset. There are three ways the market can go:
- Uptrend
- Sideways Market
- Downtrend
When the market is in an uptrend, the market displays higher highs and higher lows. When the market is in an uptrend the financial asset is said to be bullish. When the market is in a sideways market, the market trades within a range. This range is defined by support and resistance lines which we will come to later. When the market is in a downtrend, the market displays lower lows and lower highs and is said to be bearish. We will show examples of these trend types below:
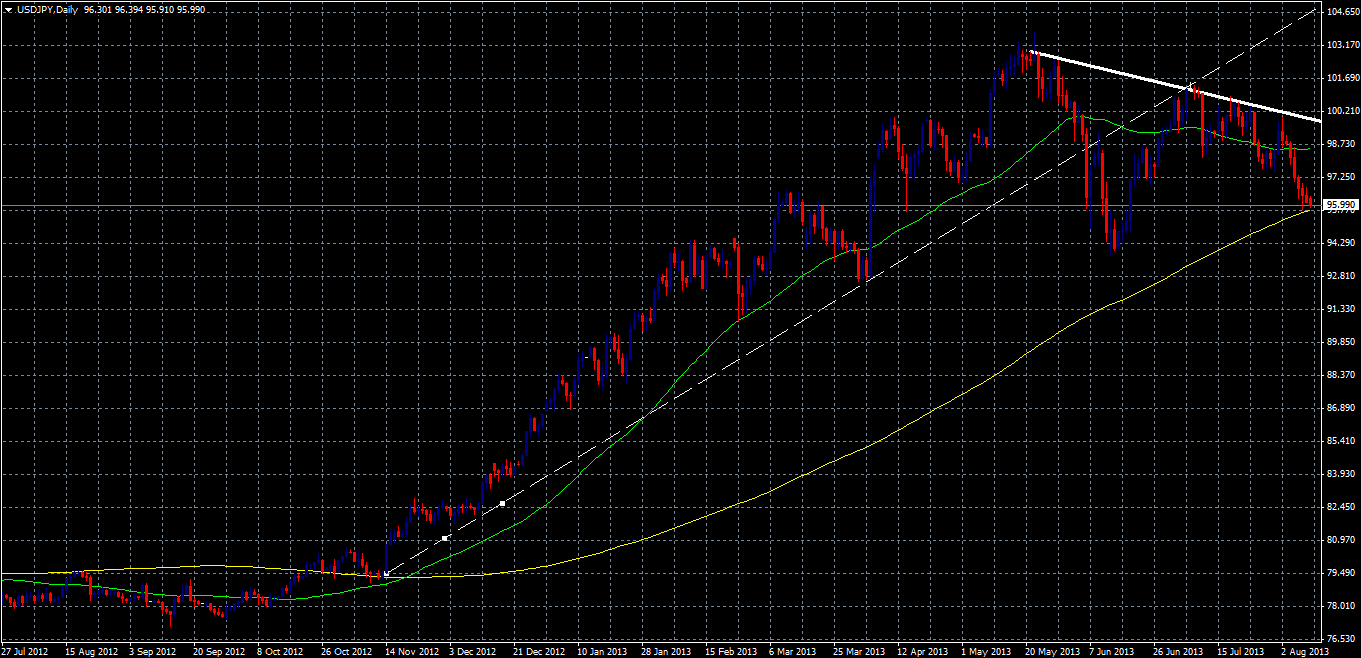
Here we can see that the pair USD/JPY is clearly in an uptrend (signified by white dashed line). We then identify later a trend line which is a resistance to the pair (signified by white line). We have outlined what resistance is below.
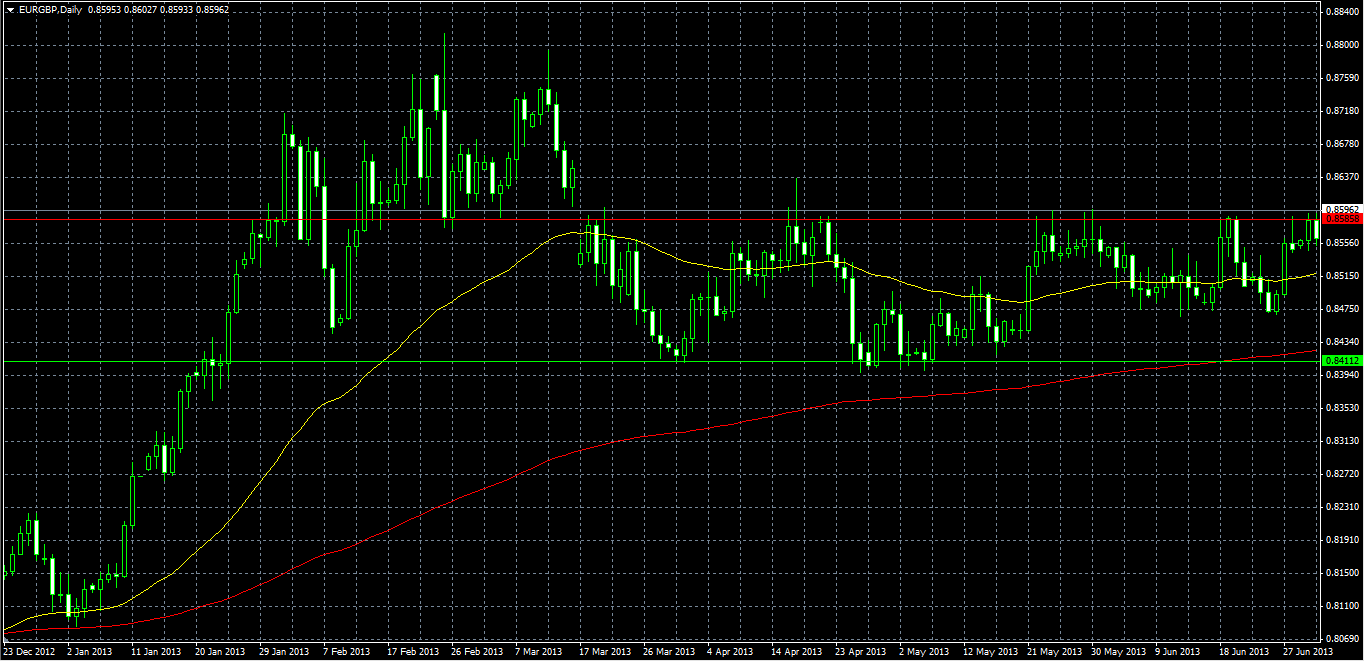
Here we can see the pair EUR/GBP in a sideways market and the trading range is between the outlined levels in the chart. The resistance level is denoted by the red line and the support level is denoted by the green line.
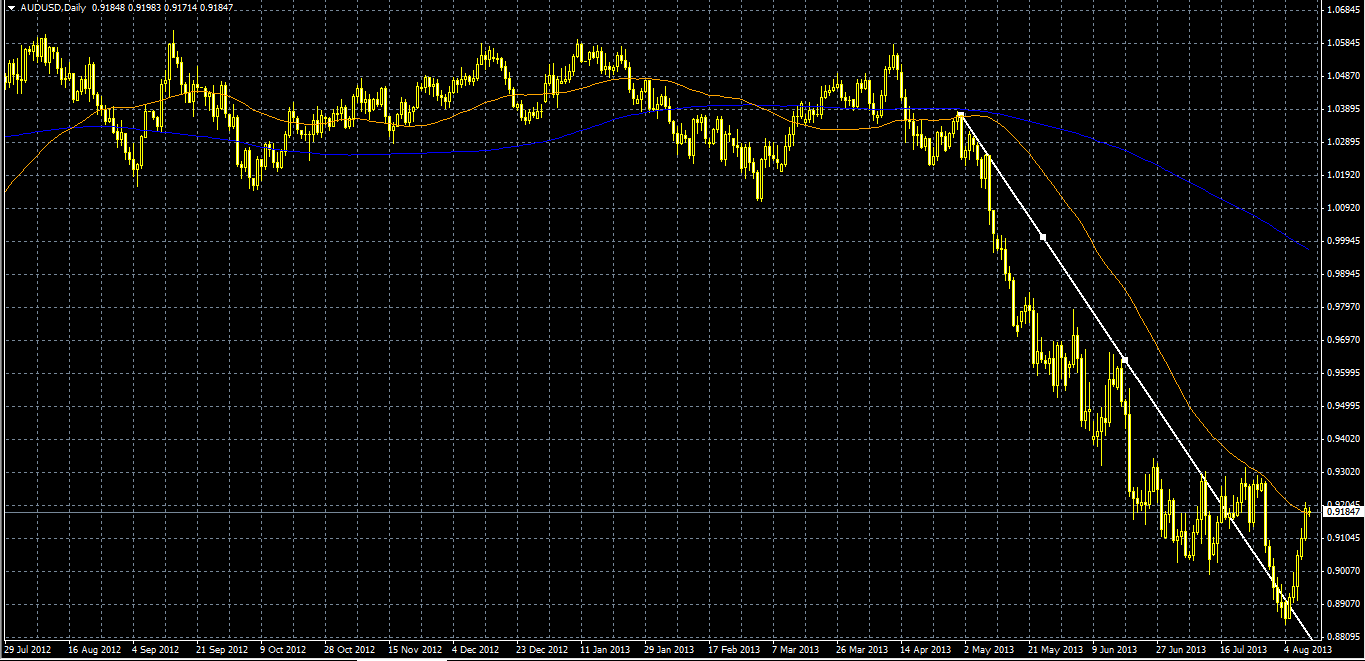
Here we can see the pair AUD/USD in a downtrend otherwise known as bearish (signified by white line).
Before we look into a sideways market we shall first look at support and resistance. These levels are based on past data. A support level is where the price has previously bounced. This bounce may happen repeatedly, it is also known as a floor or ceiling for an asset. A resistance level is often called a ceiling and the resistance level is when the price of an asset hits this ceiling and bounces off it. There can be multiple resistance and support levels. There is also some psychology involved. When the price hits a support level there are usually more buyers than sellers in the market thus increasing the price of the asset. Conversely a bounce off the resistance level is usually made when there are more sellers in the market. However, it is important to note that these levels can be broken.
A strategy can be developed as follows; when the price bounces off support then a buy signal is normally generated and conversely when the price bounces of resistance a sell signal is normally displayed. When a resistance level is broken this then becomes our new support and a buy signal is displayed. Conversely when a support level is broken a sell signal displayed and this level becomes our new resistance.
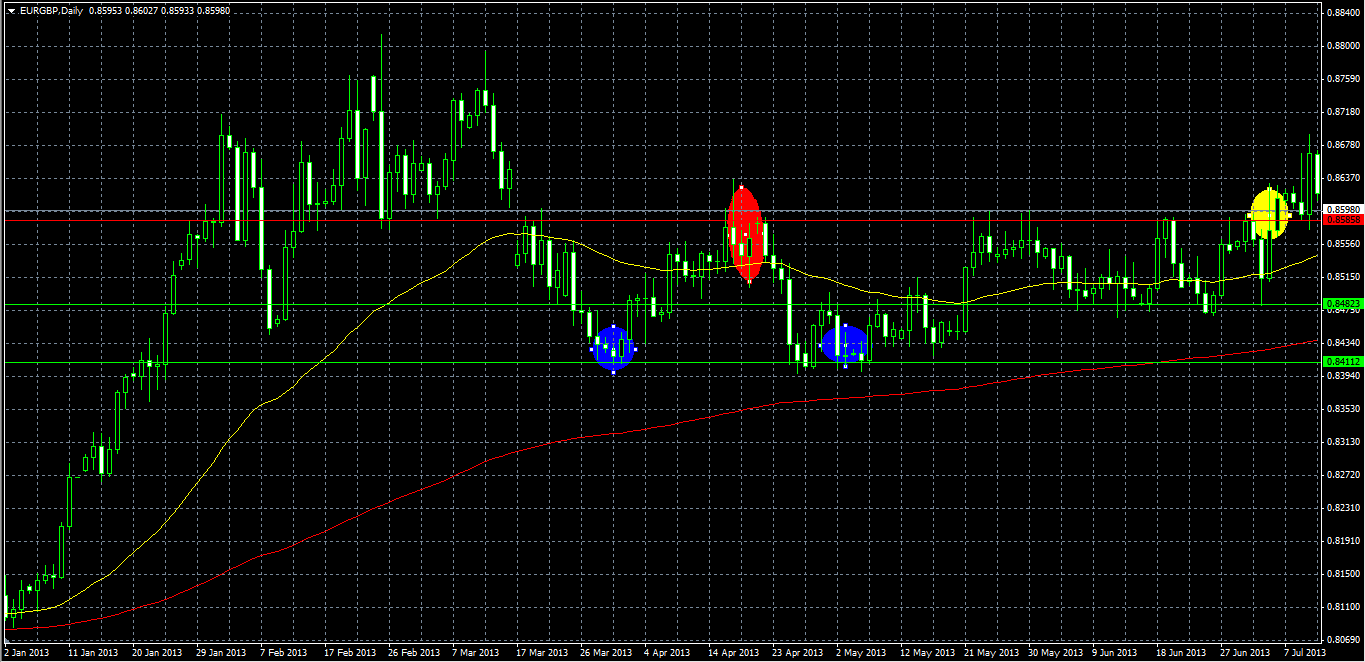
We can use the EUR/GBP as an example:
We have highlighted with ellipses where buy and sell signals are made with the blue ellipses signalling to buy and the red ellipses signal to sell. After some time, the pair’s range is squeezed and this causes the support to rise from 0.84112 to 0.8423. This, therefore, becomes our new range and the same strategy may be implemented. The yellow ellipse shows a breakout from the range and indicates a buy signal.
We can also use indicators on a trading platform to help us identify the market trend. One of the most useful indicators are moving averages, these can help a trader indentify a trend. In addition a trader can use the moving average cross-over strategy, which signifies a reversal of the trend. It is important to note that there can be significant lag between the indicator and the market displaying these signals. It is also advisable not to rely solely on one indicator.
CFDs, spread betting and FX can result in losses exceeding your initial deposit. They are not suitable for everyone, so please ensure you understand the risks. Seek independent financial advice if necessary.
Nothing in this article should be considered a personal recommendation. It does not account for your personal circumstances or appetite for risk.

)