


What is Rate of Change?
Rate of change is a momentum oscillator. It can be measured in percentage or in decimal form. Just like RSI it can be used to identify overbought and oversold levels. The saying ‘the trend is your friend’ can be applied to this scenario, the rate of change indicator can be used to identify the trend direction. In addition, as it is a momentum oscillator it can identify the strength of the trend. The overbought levels are above the zero line and oversold levels are below. Just like any momentum oscillator, when the ROC is negative, the asset is in a downtrend. A general rule of thumb is when the slowing moving (longer time period) ROC is in an uptrend, then we will have a trend reversal. It is important to note that faster moving ROC can produce faster signals for trend identification.
When the ROC is in the overbought region, a sell signal is issued. If the ROC is in the oversold region, then it is a buy signal. We will be using the GBP/JPY as an example and we outline buy and sell signals displayed:
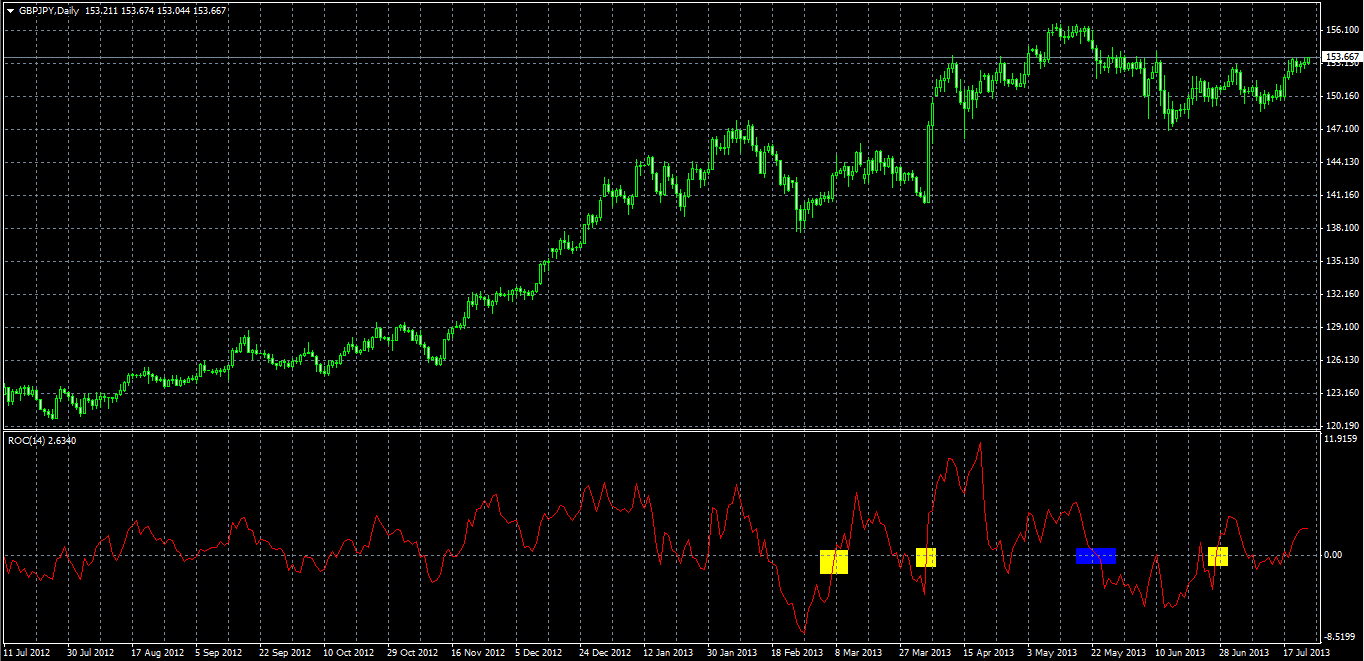
We have displayed, using the rectangular boxes where buy and sell signals should take place, if the ROC line crosses above zero and the asset retraces, then it is a buy signal denoted by the yellow rectangles. Blue rectangles denote a sell signal. We can also that when ROC is in the overbought region it retraces back to the zero level just like any other indicator, and long and short positions can be taken at the peaks of highs and lows respectively on the ROC.
The calculation of rate of change is quite simple, just think of how you would calculate a percentage increase or decrease of a product. So to calculate the percentage change:
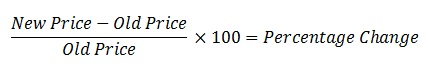
We use this methodology to calculate rate of change in financial markets except, it’s done over a period of days defined by the user. Suppose you want to calculate the rate of change over 12 days, then we would calculate ROC with the following:

The rate of change indicator is limitless so it can go to any percentage, which can be quite deceiving, as you could have the price of the asset fall to zero if the rate of change is -100%.
It is important to note, that the using ROC does have disadvantages just like any other indicators. It will depend on what time frame you put the ROC indicator on, which will define whether a buy or sell signal is appropriate. As you can imagine, the rate of change indicator cannot be used in a sideways market, as ROC can only be used in a trending market.
The rate of change indicator should be used in conjunction with other indicators and fundamentals and stop losses should be used. This will reduce your losses considerably, as you will be looking at the bigger picture.
CFDs, spreadbetting and FX can result in losses exceeding your initial deposit. They are not suitable for everyone, so please ensure you understand the risks. Seek independent financial advice if necessary.
Nothing in this article should be considered a personal recommendation. It does not account for your personal circumstances or appetite for risk.
