


Moving Average Crossovers
A popular opportunity-identification technique used by traders and investors is the moving average crossover. Before I present an example, some definitions will be useful:
- A “moving average” is simply the average price recorded over the past N days, and it serves to smooth out some of the price volatility so that you can more clearly see the overall trend. The longer the number of days that are averaged, the smoother the line, and the longer the price trend that is being indicated.
- A “moving average crossover” is the point at which the line indicating a shorter moving average (e.g. the 20-day MA) crosses upwards through the line indicating a longer moving average (e.g. the 50-day MA).
In the example that follows, you will see how a moving average crossover trading strategy might work, and also how it might fail if you don’t understand the “lagging” nature of moving averages.
Moving Average Crossover Example
In the following contrived (so that it shows what I want it to show) example based on a real price chart, you can see how selling short at labelled point 1, then buying net long at labelled point 2, then selling out at labelled point 3 would have generated some nice profits. These were the points at which the 20-day moving average crossed upwards and downwards through the 50-day moving average, indicating a change of trend.
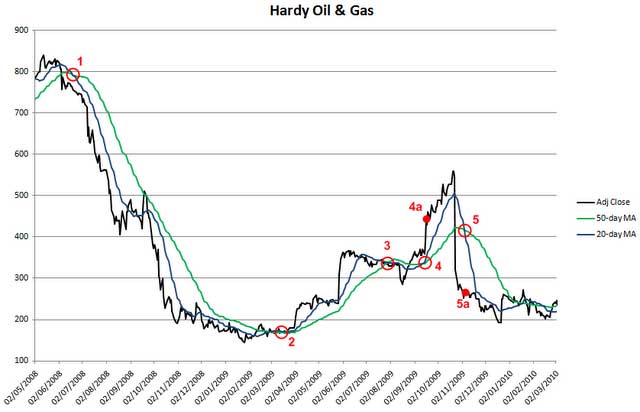
I have chosen the 20-day and 50-day moving averages retrospectively in this case, because with perfect hindsight I know that they produced profitable crossovers. Choosing the right combination of moving averages in advance with imperfect foresight is rather more difficult and there is not necessarily a foolproof one-size-fits-all solution. And there’s another problem too…
Judging from the labelled points 4 and 5 you would think at first glance that those too would have been profitable crossovers. Look again; noting that at the time of those crossovers the market prices – labelled as 4a and 5a – were much different from the crossover prices. By buying on the crossover signal 4 (at price 4a, about 450p-per-share) and then selling on crossover signal 5 (at price 5a, about 270p-per-share) you would have succeeded in buying high and selling low despite the crossovers themselves giving the appearance of buying low and selling high.
Moving Average Fans
I know of traders who do use moving average crossovers successfully as part of their trading strategies. Their success seems to hinge on using moving averages as one indicator among many rather than trading solely on the basis of a moving average signal.
These “fans” of moving averages also tend to look out for various moving averages “fanning out” from a point, so they might (for example) take a trade when the 20-day MA has risen above the 50-day MA which in turn his risen above the 200-day MA. This kind of signal may be most effective on even shorter timescales and on highly liquid non-equity markets like foreign exchange (forex) currency pairs.
